Figure 6.
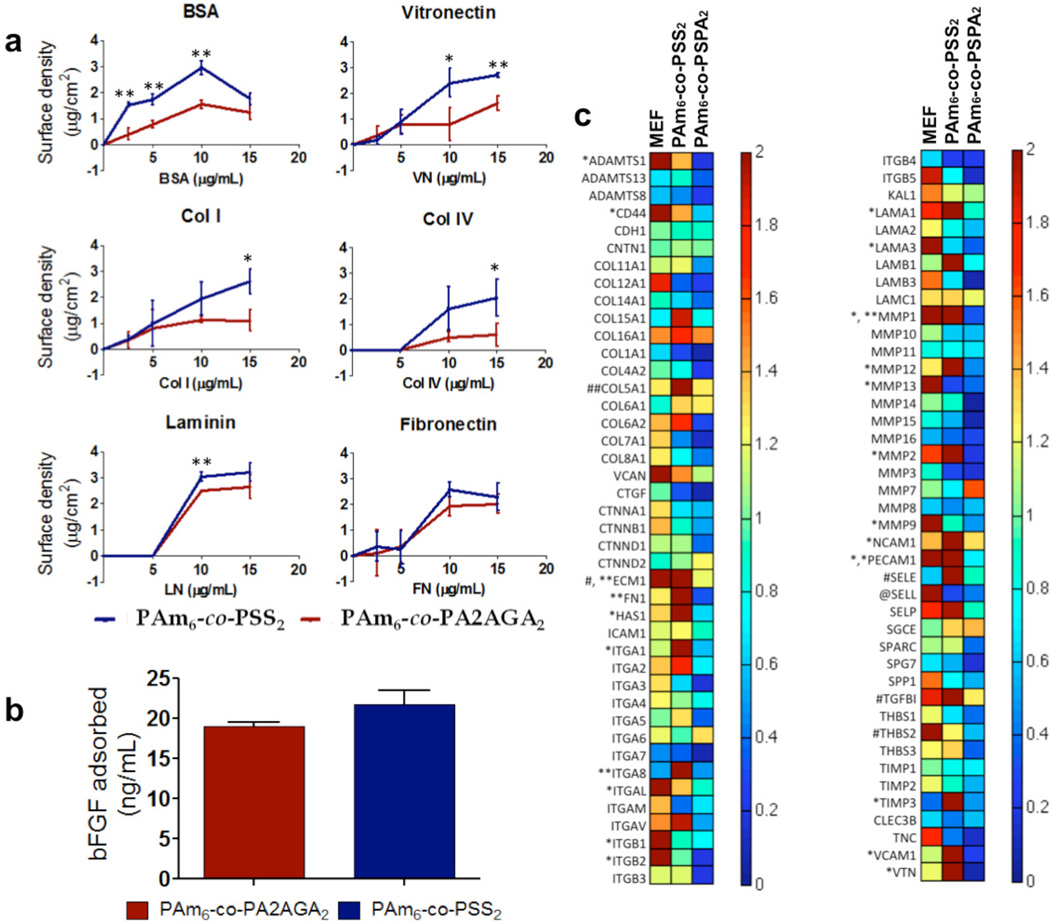
Characterization of cell-material interface. (a) Quantification of various extracellular matrix proteins adsorbed onto PAm6-co-PSS2 hydrogel (blue) and PAm6-co PA2AGA2 hydrogel (red). BSA; bovine serum albumin, VN; vitronectin, Col1; collagen type I, Col4; collagen type IV, LN; laminin, FN; fibronectin. (b) bFGF adsorption onto PAm6-co-PSS2 (blue) and PAm6-co-PA2AGA2 (red) hydrogel(s). Values are shown as mean ± SD. *p < 0.05 and ** p < 0.01, (c) Hierarchical cluster analysis of transcription profile of HUES9 cells cultured on MEFs, PAm6-co-PSS2, and PAm6-co-PSPA2. Expression levels are normalized to that of Matrigel. The notations *, **, #, and ## indicates 2–5 times, 5–10 times, 10–15 times, and >15 times of relative fold inductions, respectively.

