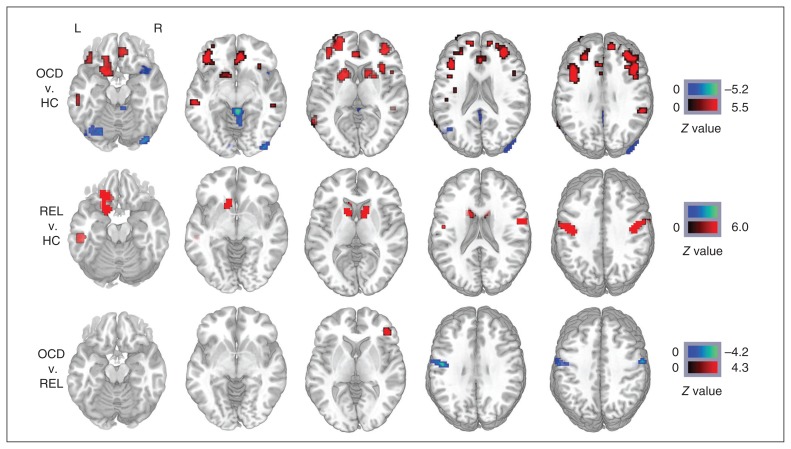
Fig. 1.
Whole brain difference of functional connectivity strength maps among 3 groups. The colour bar indicates the statistical significance threshold. The left side of the image corresponds to the left hemispheric regions. Map thresholds were set at p < 0.05 with multiple comparisons. HC = healthy controls; L = left; OCD = obsessive–compulsive disorder; R = right; REL = first-degree relatives of patients with OCD.

