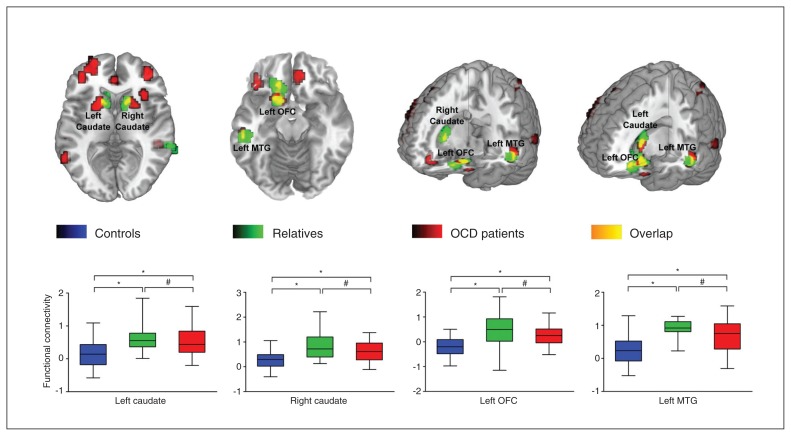
Fig. 2.
The overlapping regions of abnormal functional connectivity strength in patients with obsessive–compulsive disorder (OCD) and their healthy first-degree relatives. The box plot represents connectivity strength values of the 3 groups at the peak of the overlapping regions. Blue denotes the healthy control group, green denotes the first-degree relative group or abnormal brain regions in first-degree relatives, red denotes patients with OCD or abnormal brain regions in these patients, and yellow denotes the overlapping regions of abnormal functional connectivity strength regions between patients with OCD and their healthy first-degree relatives. *p < 0.001; #p > 0.05. MTG = middle temporal gyrus; OFC = orbitofrontal cortex.

