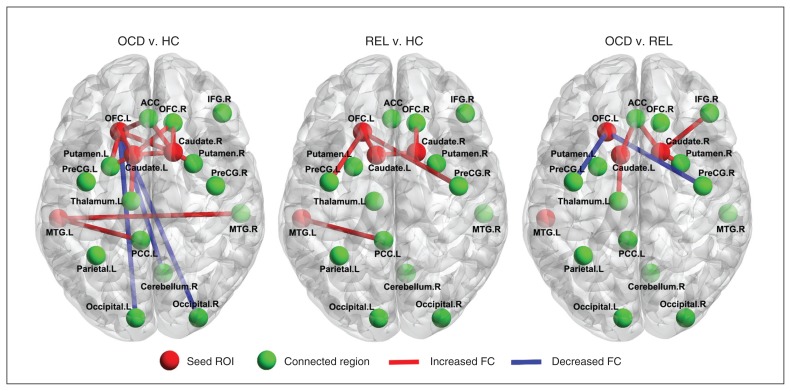
Fig. 3.
Abnormal interregional correlations in the patients with obsessive–compulsive disorder (OCD) and their first-degree relatives. Red denotes the brain regions with increased functional connectivity (FC) and blue denotes the brain regions with reduced functional connectivity. Map thresholds were set at p < 0.05 with multiple comparisons. ACC = anterior cingulate cortex; HC = healthy controls; IFG = inferior frontal cortex; L = left; MTG = middle temporal gyrus; OFC = orbitofrontal cortex; PCC = posterior cingulate cortex; PreCG = precentral gyrus; R = right; REL = first-degree relatives of patients with OCD; ROI = region of interest.

