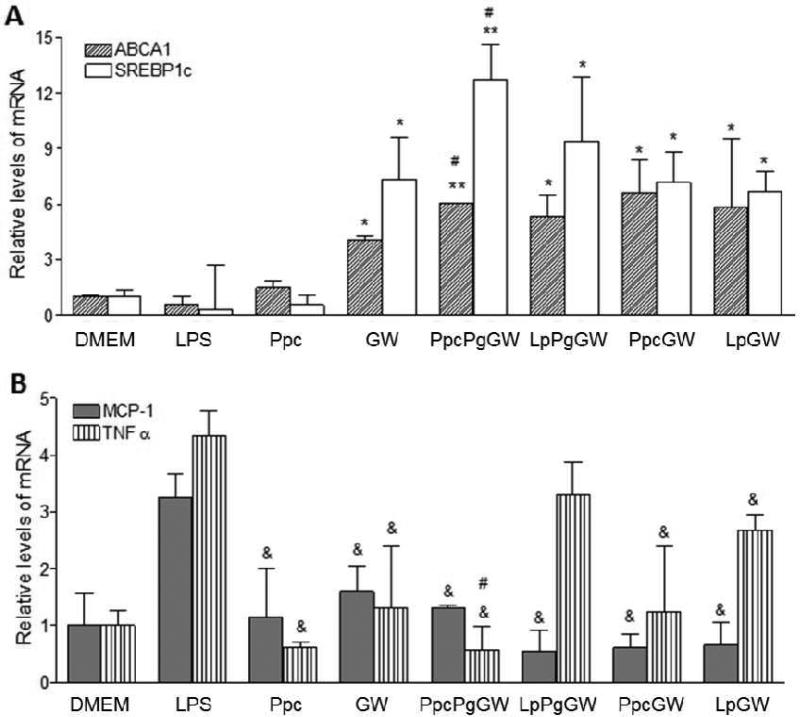
Figure 4.
Peritoneal macrophages were treated with Ppc, GW 1μM, PpcPgGW 1μM, LpPgGW 1μM, PpcGW 1μM, or LpGW 1μM. Following 18 h, the cells were incubated with 100ng/ml LPS for 6 more hours. The gene expression was measured by real time quantitative PCR for ABCA1 and SREBP-1c (A) and TNFα and MCP-1 (B). Each bar represents the Mean ± SEM. *p < 0.05 vs DMEM, LPS and Ppc; #p < 0.05 vs GW; &p<0.05 vs LPS

