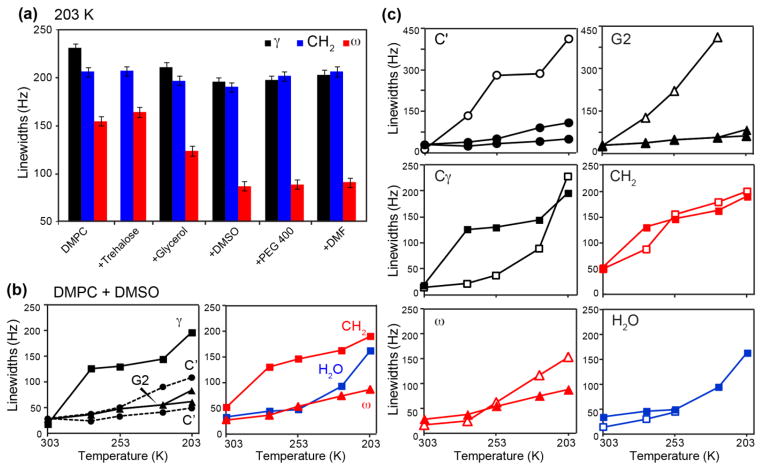
Figure 7.
Comparison of 13C and 1H linewidths of DMPC bound to different cryoprotectants and at different temperatures. (a) Cryoprotectant comparison at 203 K. The C, C 2 and linewidths are plotted. DMSO and PEG-400 induce the narrowest lipid linewidths. (b) Temperature dependence of the 13C linewidths of DMSO-bound DMPC and the 1H linewidths of water. Two linewidths are plotted for G2 and C′ due to the presence of two conformations. (c) Comparison of DMSO-bound (filled symbols) and control (open symbols) DMPC 13C linewidths and water 1H linewidths as a function of temperature. The C′ and glycerol backbone G2 show the largest linewidth reduction by cryoprotection.

