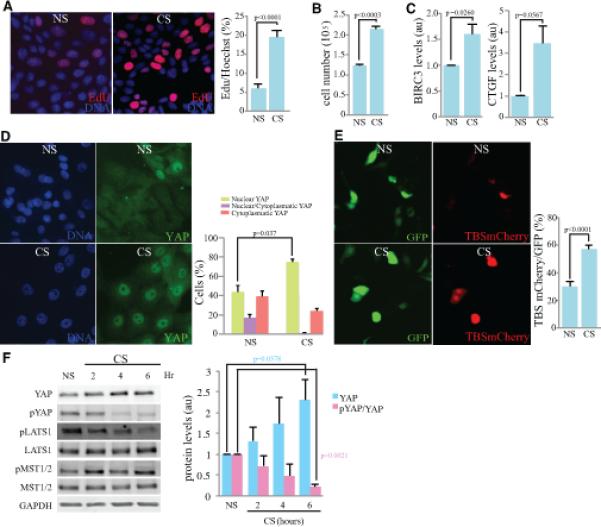
Figure 1. Cyclic stretch increases YAP activity through down-regulation of Hippo signaling.

Comparisons of MCF10A cells subject to cyclic stretch (CS) and non-stretched controls (NS) are shown. A) Cell proliferation, visualized by Edu labeling (red) after 6 h CS, with nuclei labeled by Hoechst (blue). Histogram at right shows quantitation of the mean percent labeled cells, from three biological replicates. B) Quantitation of cell numbers after 6 h CS compared to NS controls, from three biological replicates. C) Histogram shows result of quantitative RT-PCR on BIRC3 and CTGF mRNA level in cells after 6 h CS compared to NS controls, from three biological replicates. The mRNA over GAPDH ratio in all samples were normalized to the ratio in NS control cells. D) Immunolocalization of YAP (green) after 6 h CS compared to NS controls. Histogram at right shows quantitation of the mean percent cells with predominantly nuclear YAP, from three biological replicates. E) Cells co-transfected with TBS-mCherry (red) and GFP (green) after 6 h CS compared to NS controls. Graph indicates the percentage of GFP-expressing cells that are positive for TBS-mCherry, from three biological replicates. F) Western blot on lysates of cells after 2h, 4h, and 6 h CS, compared to NS controls, blotted with anti-YAP, anti-pYAP, anti-pLATS, anti-LATS, anti-pMST, anti-MST and anti-GAPDH, as indicated. Histogram shows average (from three biological replicates) of relative levels of YAP normalized to GAPDH (loading control), together with ratio of pYAP/YAP. In all panels, error bars indicate standard error. See also Fig. S1.
