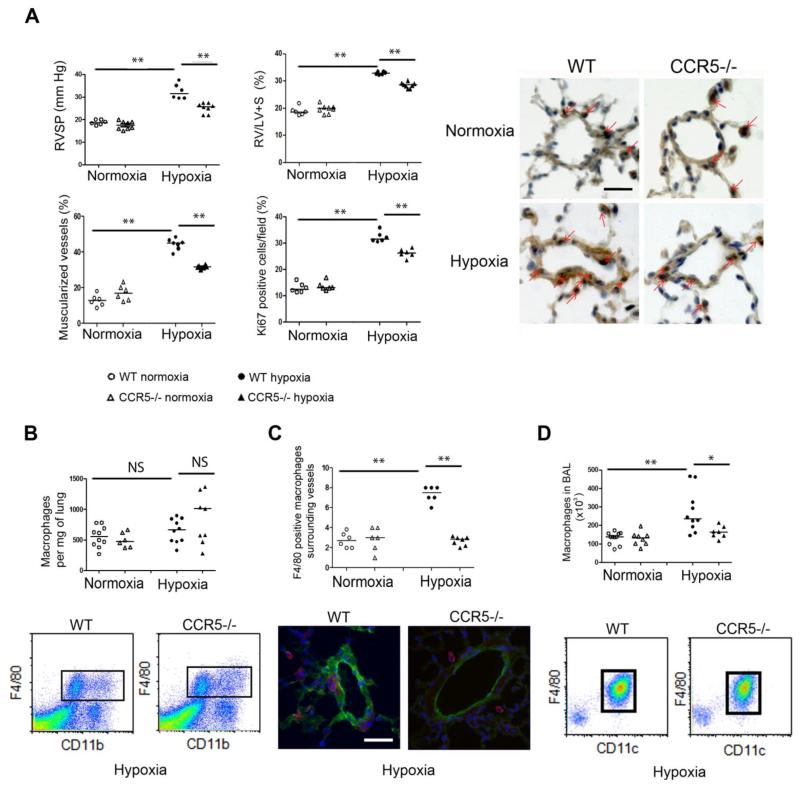
Figure 3.
CCR5 gene deficiency abrogates the development of hypoxic PH in mice. (A)- Graphs of right ventricular systolic pressure (RVSP) and right ventricular hypertrophy index (RV/[left ventricle plus septum (LV+S)] weight), pulmonary vessel muscularization, and dividing Ki67-positive cells in wild-type (WT) mice and CCR5−/− mice under normoxia and hypoxia. Representative micrographs of pulmonary vessels stained for Ki67 are shown in the right panel. Red arrows show Ki67-positive nuclei. No immunoreactivity was detected in sections incubated with rabbit IgG control and secondary anti-rabbit antibody. Bar=50 μm. (B)- Total macrophage counts in the lung. Graph shows the number of CD11b F4/80-positive macrophages isolated from 1 mg of lung tissue and micrographs showing representative FACS profiles of cells from mouse lungs. (C)- Macrophage counts surrounding small pulmonary vessels. Graph shows the number of perivascular F4/80-positive macrophages detected using α-SMA staining. Micrographs show representative staining of macrophages surrounding lung vessels in WT and CCR5−/− mice under hypoxia; F4/80 (Red), α-SMA (Green), Dapi (Blue). No positive immunoreactivity was detected in sections incubated with control IgG followed by secondary anti-rabbit or anti-rat antibody. (D)- Macrophage counts in bronchoalveolar lavage (BAL) fluid. The graph shows the number of CD11c- and F4/80-positive macrophages. Micrographs show representative FACS profiles of BAL fluid cells from WT and CCR5 −/− mice under hypoxia. For all graph, both individual and median values are represented. * P<0.025 **P<0.005.

