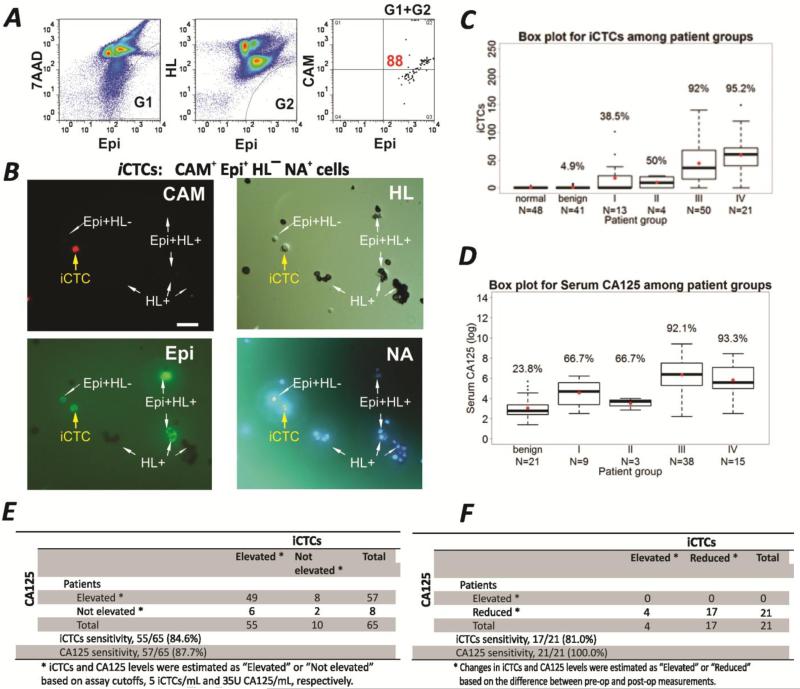
Fig. 1. Measurement of iCTCs in pre-op and post-op patients with high risk of EOC.
The number of iCTCs was measured in 1.0-mL of blood. (A) An example of flow cytometry enumeration of iCTCs by FITC-CAM(+) / PE-anti-Epi(+), APC-anti-HL(−), and 7AAD(+) (nuclear) fluorescence where CAM = functional uptake of matrix and Epi = tumor markers. In the first two panels, G1 and G2 gating is illustrated by the curved lines in the lower right corners. The last panel (G1+G2) is derived from sum of the G1 gated area in the first panel and the G2 gated area in the second panel; it is a plot of the gated cells with Epi positive on the X axis and CAM positive on the Y axis. 88 cells indicated in Q2 of the last panel are CAM+Epi+7AAD+HL-. (B) Validation of CAM+ flow cytometric isolation of iCTCs by microscopic imaging. An iCTC is detected as the CAM+Epi+NA+HL- cell in four fields (CAM, Epi, and NA in DAPI were detected by fluorescence, and HL was detected in DIC bright field; see yellow arrows and labels); Epis, on the other hand, were CAM-Epi+NA+HL- (white arrows and labels); HL cells were NA+HL+ (white arrows and labels); false positives were CAM-Epi+NA+HL+ (white arrows and white Epi+HL+ labels). Bar in CAM panel =40μm. (C;D) Measurement of iCTCs and serum CA125 as function of tumor stages. Mean and median iCTC and serum CA125 counts in each group are indicated by red dots and thick bars, respectively. Black dots are outliers. % patients are those that show iCTCs and CA125 levels above cutoffs, >5 iCTCs/1.0-mL blood and >35U CA125/mL. (E) Comparison of iCTCs and serum CA125 levels as blood-based biomarkers in pre-op patients. (F) Comparison of changes in iCTCs and serum CA125 levels from 21 patients between pre-op and post-op to assess the sensitivity of detecting tumor burden.

