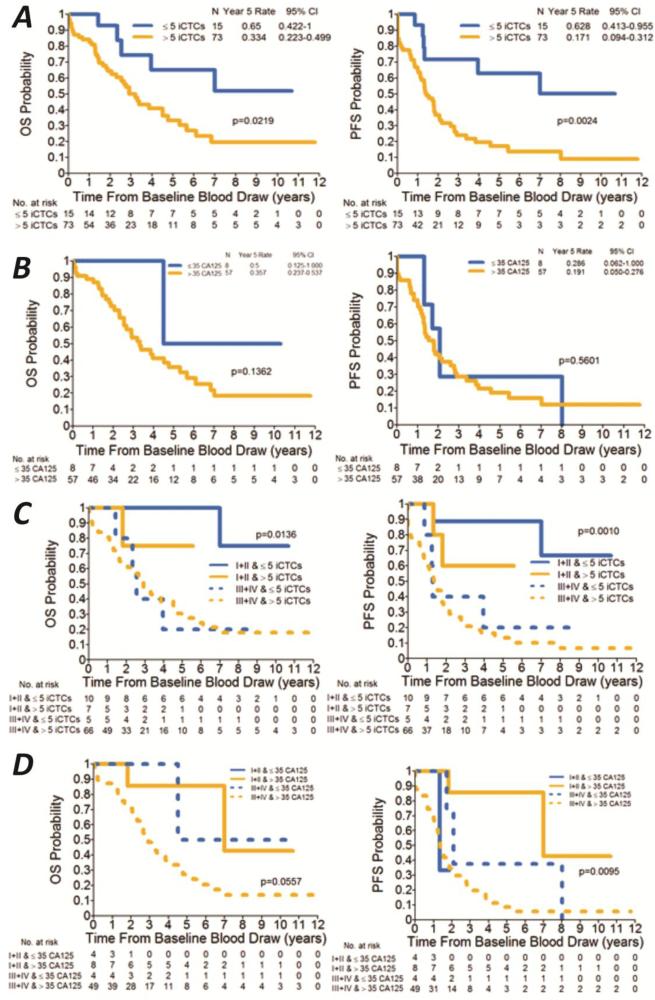
Fig. 3. Kaplan-Meier plots of OS and PFS by iCTCs (A), serum CA125 (B), iCTCs and tumor stage (C), and serum CA125 and tumor stage (D).
Negative samples are defined as ≤5 iCTCs/1-mL blood and ≤35U/mL serum CA125 levels. The difference between negative and positive groups is evaluated for significance based on the log-rank test. Relative numbers of patients with negative (top) and positive (bottom) iCTCs and serum CA125 are indicated below the year on x-axis.

