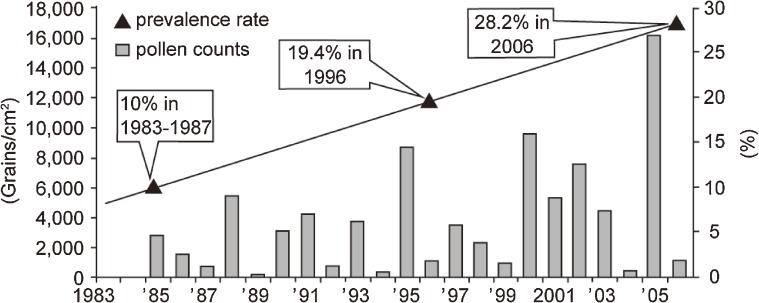
Figure 5.
Time-course of prevalence rate of pollinosis according to three successive surveys and average Japanese cedar and Japanese cypress pollen counts in Tokyo during the survey periods. ▲ represents the prevalence rate of pollinosis, and each column represents a pollen count (Modified from ref. 21).

