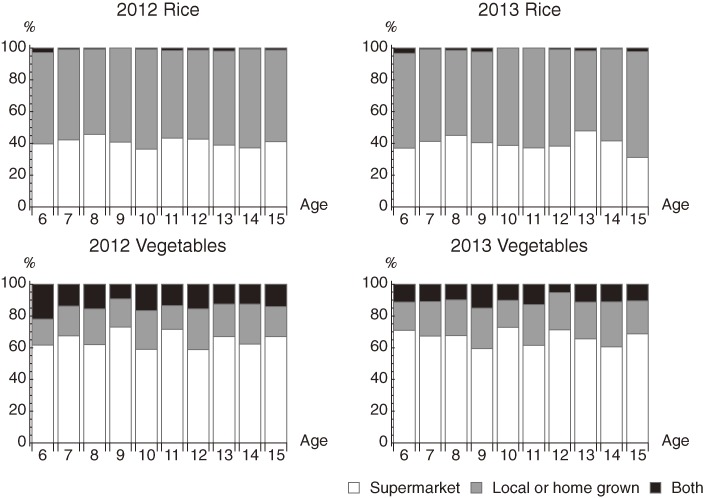
Figure 2.
Food sources by age group: 2012 (left), 2013 (right). The percentages of children who have been regularly eating local or home grown rice or vegetables are shown in gray; The percentages obtained from supermarkets is shown in white. The percentages are stable across the all age groups between 2012 and 2013.

