
Figure 8.
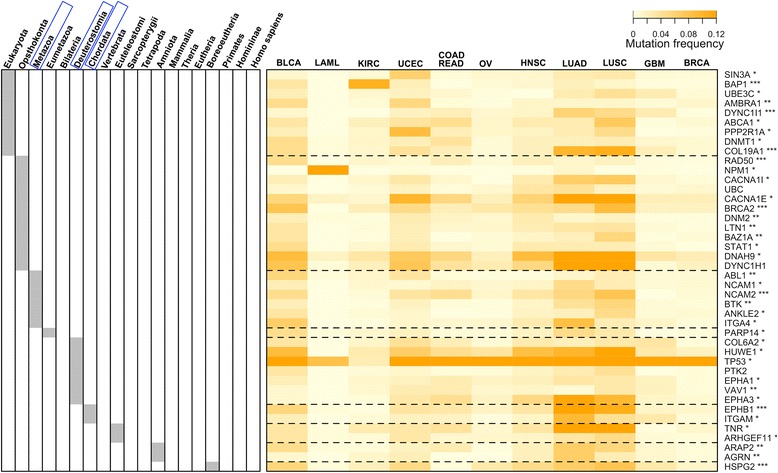
Evolutionary age of genes in the survival network. This is a heatmap of the mutation frequency of genes (in rows) versus tumour types (in columns). The tumour types are ordered based on a neighbour-joining tree (built from the mutation frequency matrix). The evolutionary history of genes is based on species tree of life (sTOL [29]). The left panel indicates the ancestor in which genes first appeared. Ancestor enrichment analysis shows that these survival genes contain a significantly higher number of genes first created at Metazoa, Deuterostomia and Chordata (framed in blue; FDR <0.05). Indicated beside the gene symbols are their Cox P values: *<0.05; **<0.01 and ***<0.005. Abbreviations for tumour types are the same as described in Figure 5.