
Fig. 5.
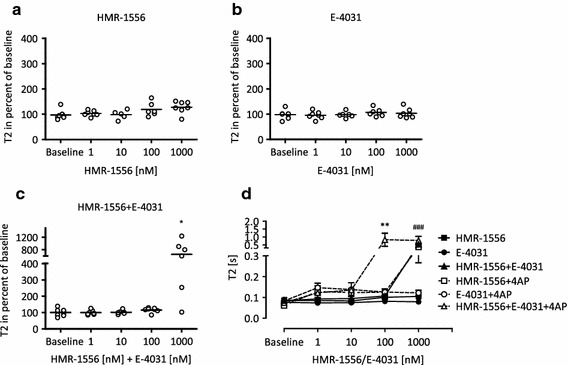
Role of IKs and IKr in rat EHTs. Statistical evaluation of relaxation time (T2) in the presence of HMR-1556 (a), E-4031(b) or the combination of both (c). Neither HMR-1556 nor E-4031 alone affected T2, but the combination of both led to a marked increase of T2 at the highest concentration (each 1 µM). d shows the concentration response curves of HMR-1556, E-4031, and the combination of both in the absence (black lines) and presence of 4AP (dashed lines; 3 mM). In the presence of 4AP, the concentration response curves for HMR-1556 and HMR-1556 + E-4031 were shifted to the left, whereas the curve for E-4031 alone was not affected. a–c each dot stands for one analyzed EHT; *p < 0.05 paired Student’s t test vs. baseline (50 nM epinephrine); d n = 4–8, data are expressed as mean ± SEM; **p < 0.003, ***p < 0.0001 vs. intervention + 4AP (#HMR-1556; *HMR-1556 + E-4031), one-way ANOVA + Tukey’s post test. Note that differences due to the presence of 4AP were not included