
Fig. 7.
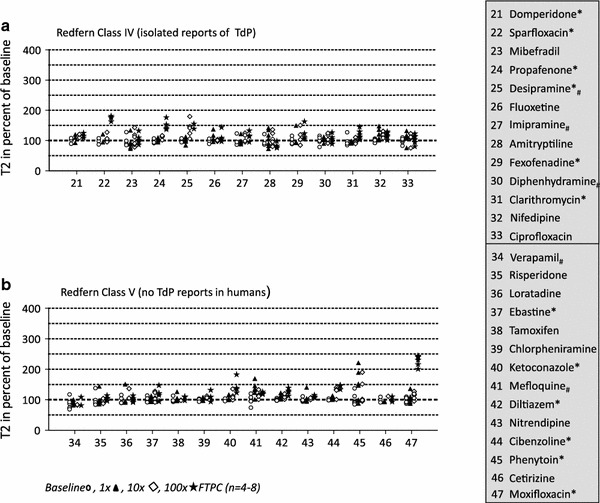
Effects of class IV–V (Redfern) drugs on rat EHT relaxation time (T2). a Shows the effect of drugs with isolated reports of TdP (class IV) and b with no reports of TdP in humans (class V). Each symbol reflects one analyzed EHT. Different concentrations are indicated by different symbols (baseline  , 1×
, 1× , 10×
, 10× , 100×
 FTPC). Statistical significant changes in T2 are indicated by an asterisk behind the drug name. Effects other than T2 prolongations are indicated by hashtag (e.g., verapamil: negative inotropic effect). Data are expressed as percent of baseline (50 nM epinephrine). *p < 0.05 paired Student’s t test vs. baseline and at least 15 % difference between means