
Fig. 8.
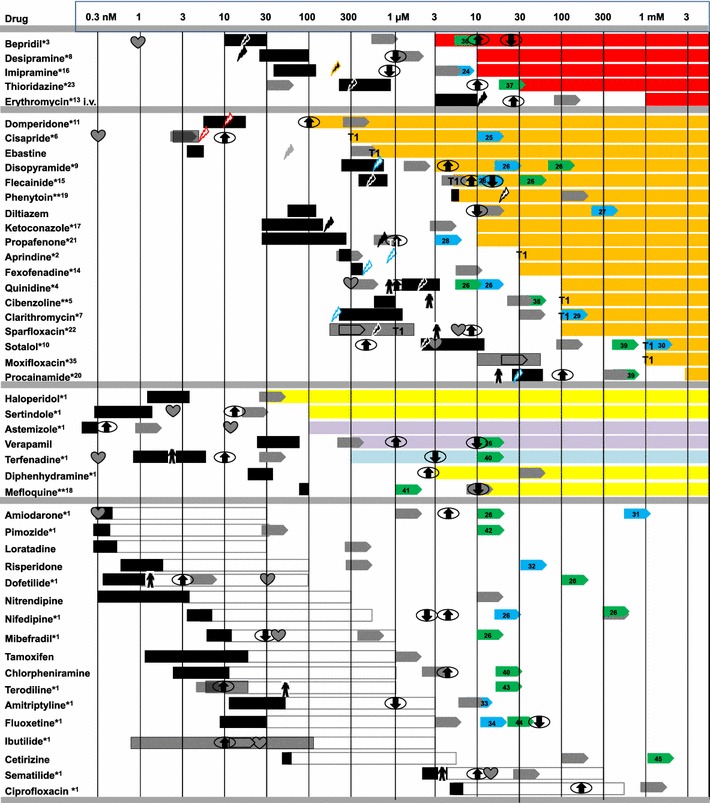
Grouping of drugs according to the type and the concentration-dependence of the effects on EHTs. All drugs were tested in 1×, 10×, and 100× free therapeutic plasma concentration (FTPC) in the presence of 50 nM epinephrine. The absolute concentration range is indicated in the first row. Group 1 encompasses drugs (red) that induced polymorphic arrhythmias, group 2 (orange) prolongations of relaxation (T2), group 3 prolongations of contraction (T1, yellow), shortening of T2 (blue), or negative inotropic effects (violet). Group 4 (white) drugs exerted no significant effect. The colored bars in group 1–3 range from the lowest tested concentration in which the indicated effect occurred (generally 10–100× FTPC) to 3 mM, regardless of whether this concentration has been tested. The white bars in group 4 indicate the tested concentration range. Also, indicated are hERG/IKr lowest published IC50 upward  ; lowest published IC50 values on Ito upward
  ; lowest published IC50 values on IKs upward
  ; concentrations associated with 10–20 % increases in APD90
 ; with decreases in APD90
 ; QTc-prolongation in vivo
  ; increased QTc in humans; estimated plasma concentration (ep) for TdP case reports in humans
  ; ep for TdP case reports in combination with other drugs/diseases
  ; ep for TdP case reports in combination with a cytochrom P450 inhibitor
  ; ep for TdP case reports in children
  ; ep QTc case reports
  ; asterisk TdP in humans known; double asterisk other types of arrhythmias in humans known. The type of depiction and most information independent of EHTs were adopted from Redfern et al. (2003). Case reports (indicated by asterisk), estimated plasma concentration and IC50 values on Ito/IKs were obtained by a literature search