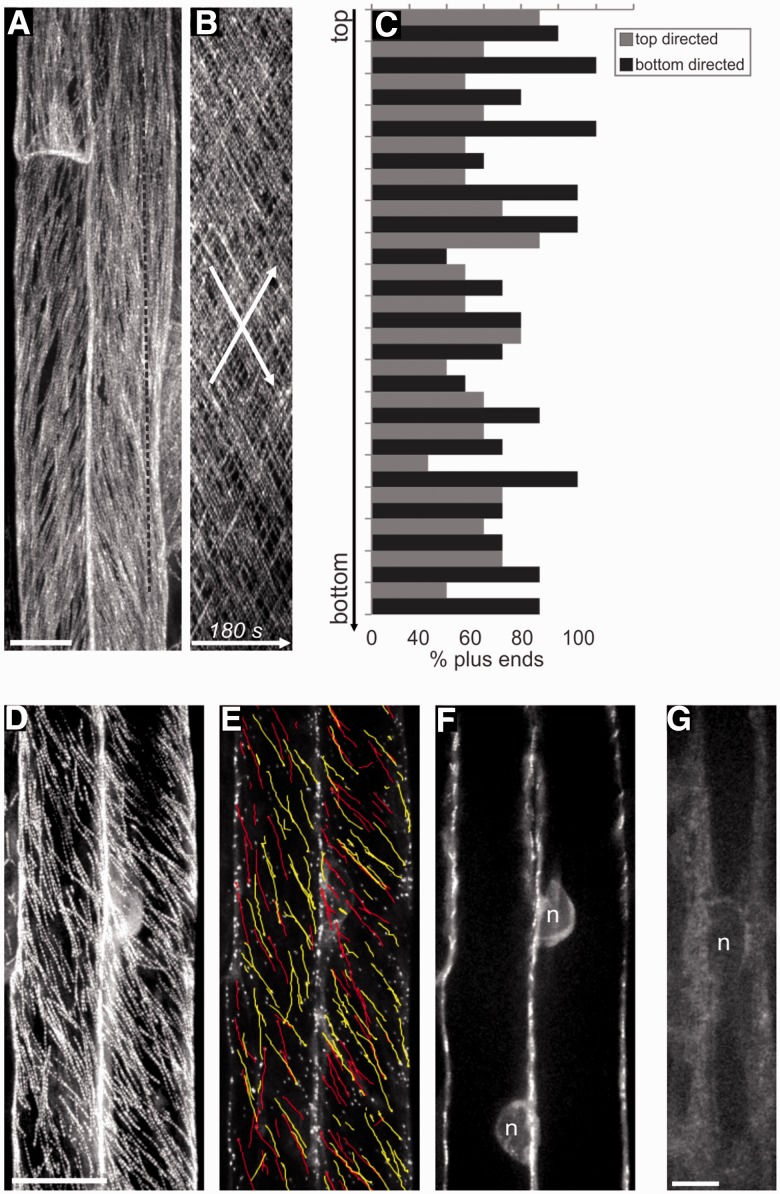
Fig. 3.
Atrichoblast cells lack bipolarity. (A) ZT projections (180 s) of EB1b–GFP in atrichoblast cells. The dotted line refers to the kymograph in B. (B) Kymograph of the cell in A corresponding to the dotted line drawn along the long axis of the cell. Arrows indicate the opposite but overlapping MT polarities. (C) Histogram showing percentages of baseward vs. tipward MT growth polarities along the length of the cell in A (the one used for the kymograph). (D) ZT projections (180 s) of EB1b–GFP in atrichoblast cells. (E) Growth paths of manually tracked EB1b–GFP dots overlaid on a single time point from cells in D. Yellow is top-directed movement and red is bottom-directed movement. (F) ZT projection of the cell midplane from cells in D and E, showing the nuclear position and lack of perinuclear MTs. (G) GFP–GCP2 localization in an atrichoblast cell. Signal does not accumulate in the perinuclear region. Scale bars, 10 µm.

