Fig. 5.
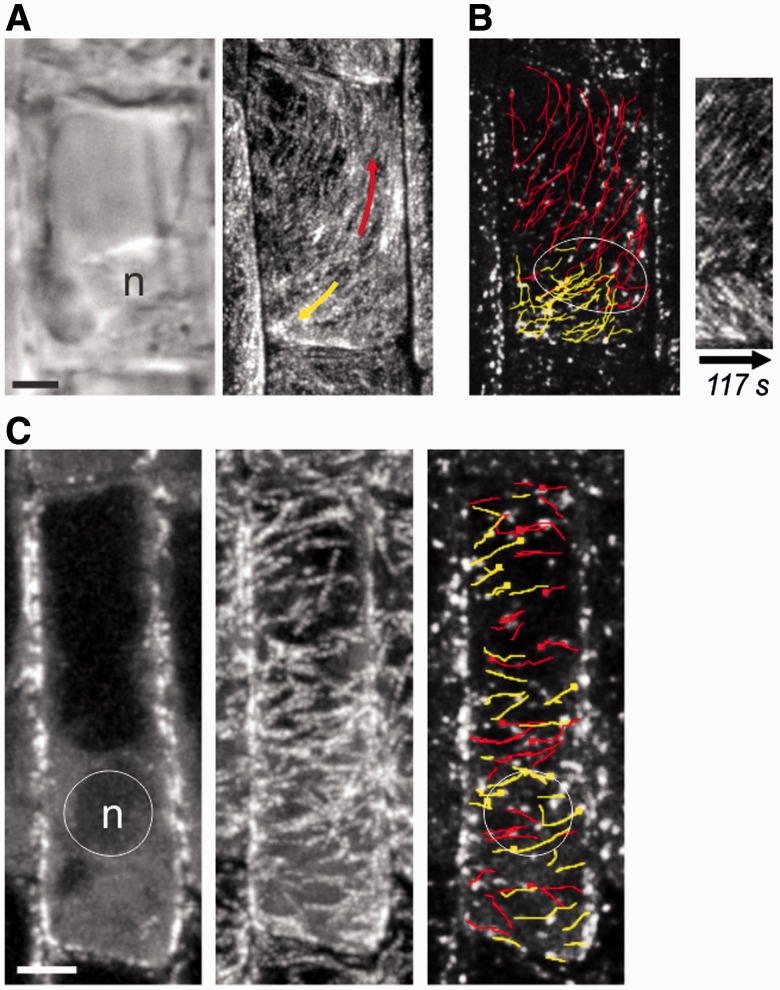
CMT bipolarity split point is the over nucleus in centrifuged root cells. (A) Epidermal division zone cell with sedimented nucleus (N). Left panel is a DIC image corresponding to the right panel, which shows a ZT projection of an EB1b-GFP time series. (B) Dual colored overlay of several EB1b-GFP dots in the cell from A. Red lines indicate upward transit, and yellow lines indicate downward transit. To the right is a kymograph drawn from this cell showing split polarity. (C) Lack of CMT growth polarities in cells with sedimented nuclei that lack MTOC activity. An elongated lateral root cap cell is shown. Left panel: the cellular midplane showing the nuclear position at the bottom of the cell. Middle panel: ZT projection of the same cell. Right panel: overlay of several EB1b–GFP growth paths. Red lines indicate right transit, and yellow lines indicate left transit. n, nucleus. Arrows indicate EB1b–GFP growth polarities. Time intervals are 5 s between time points. Scale bars, 5 µm.

