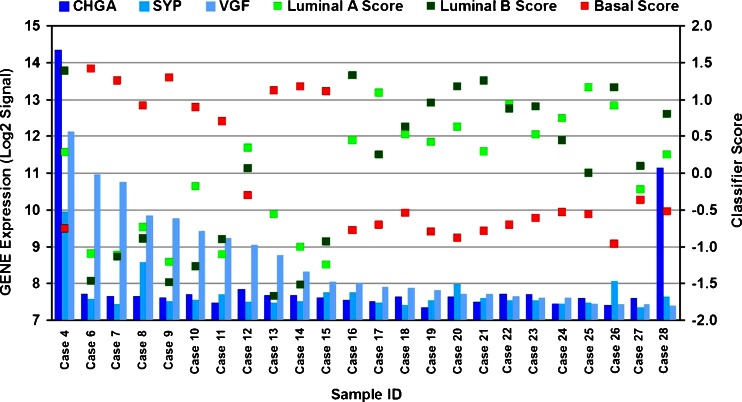
Fig. 3.
In the waterfall plot, the 24 samples are sorted from left to right according to decreasing levels of VGF mRNA (light blue columns, left y-axis scale). For each sample, the coloured squares represent one of the three transcriptional scores (right y-axis scale): luminal a (green), luminal b (dark green) and basal (red). Blue and dark blue columns represent SYP and CHGA, respectively. Except for the sample expressing the highest VGF levels, carrying a luminal B profile, samples displaying high levels of VGF (above a log2 signal of 9) have a basal-like profile

