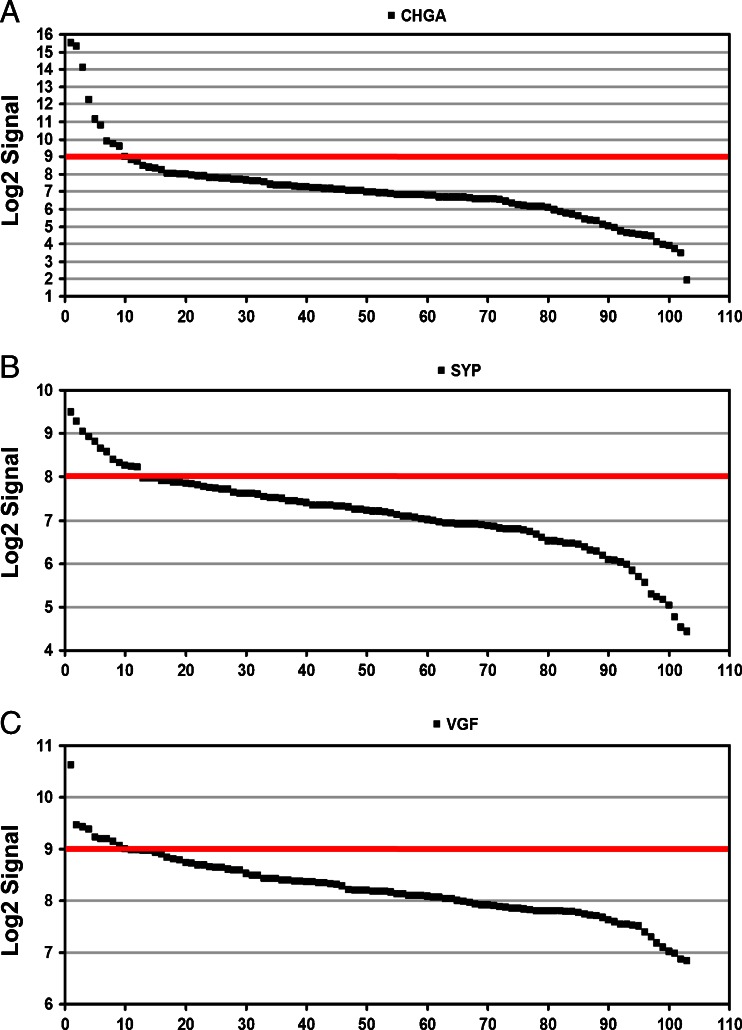
Fig. 6.
Expression of CHGA, SYP and VGF in 103 breast cancer samples. Waterfall plots showing the expression levels of a CHGA, b SYP and c VGF in 103 breast cancer biopsies. In each panel the samples are sorted by descending levels of the respective gene analysed. The red lines indicate the threshold above which samples are considered to express high levels of the gene

