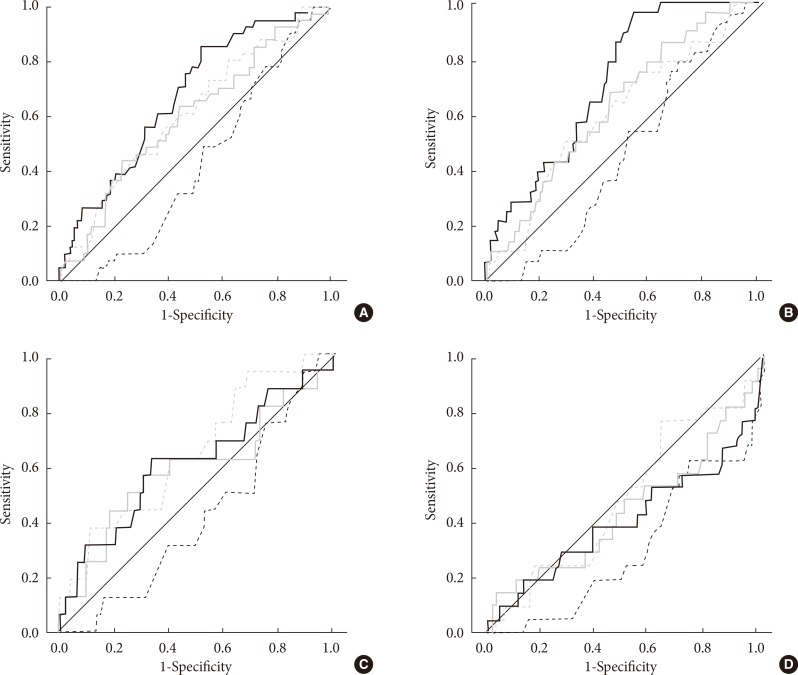
Fig. 1.
Receiver operating characteristic (ROC) curve of the current perception threshold (CPT) for predicting neuropathy. (A) ROC curves of CPT for diabetic polyneuropathy, (B) results of the 10-g monofilament test, (C) abnormality of the neuropathy total symptom score-6 (NTSS-6), and (D) autonomic neuropathy. The solid and dashed lines represent the ROC curves of CPT at 2,000 Hz and 5 Hz, respectively, and the black and gray lines represent the ROC curves at the C7 and L5 levels, respectively.

