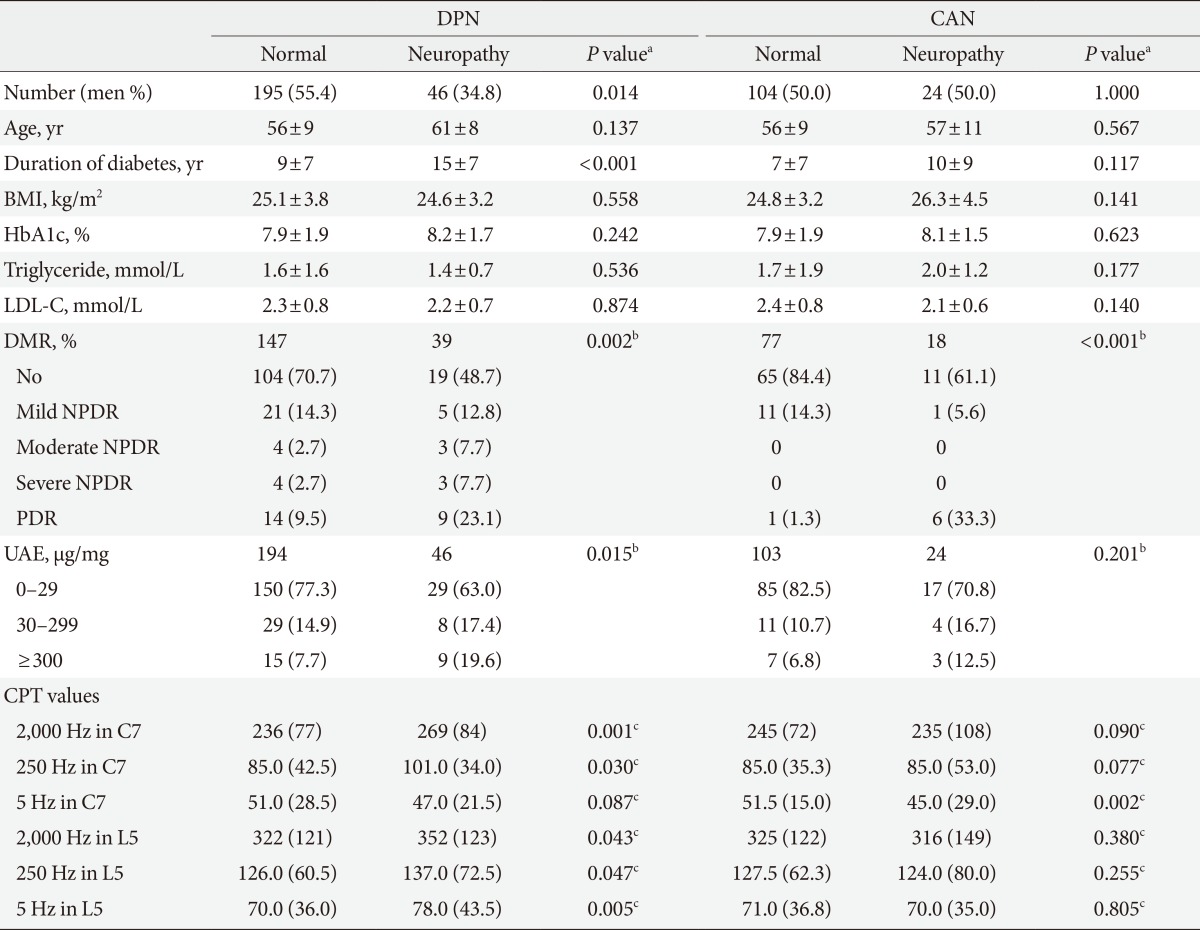
Table 2.
CPT according to diabetic neuropathy

Values are presented as number (%) or mean±standard deviation. The CPT are presented as median (interquartile range).
CPT, current perception threshold; DPN, distal polyneuropathy; CAN, cardiovascular autonomic neuropathy; BMI, body mass index; HbA1c, hemoglobin A1c; LDL-C, low density lipoprotein cholesterol; DMR, diabetic retinopathy; NPDR, nonproliferative diabetic retinopathy; PDR, proliferative diabetic retinopathy; UAE, urine albumin excretion ratio.
aP value from comparisons between the subjects with or without neuropathy, bP value from linear-by-linear analysis, cP values from Mann-Whitney test, the number of subjects with normal vs. (hypoesthesia+hyperesthesia) range of CPT according to the group was compared with the chi-square test.
