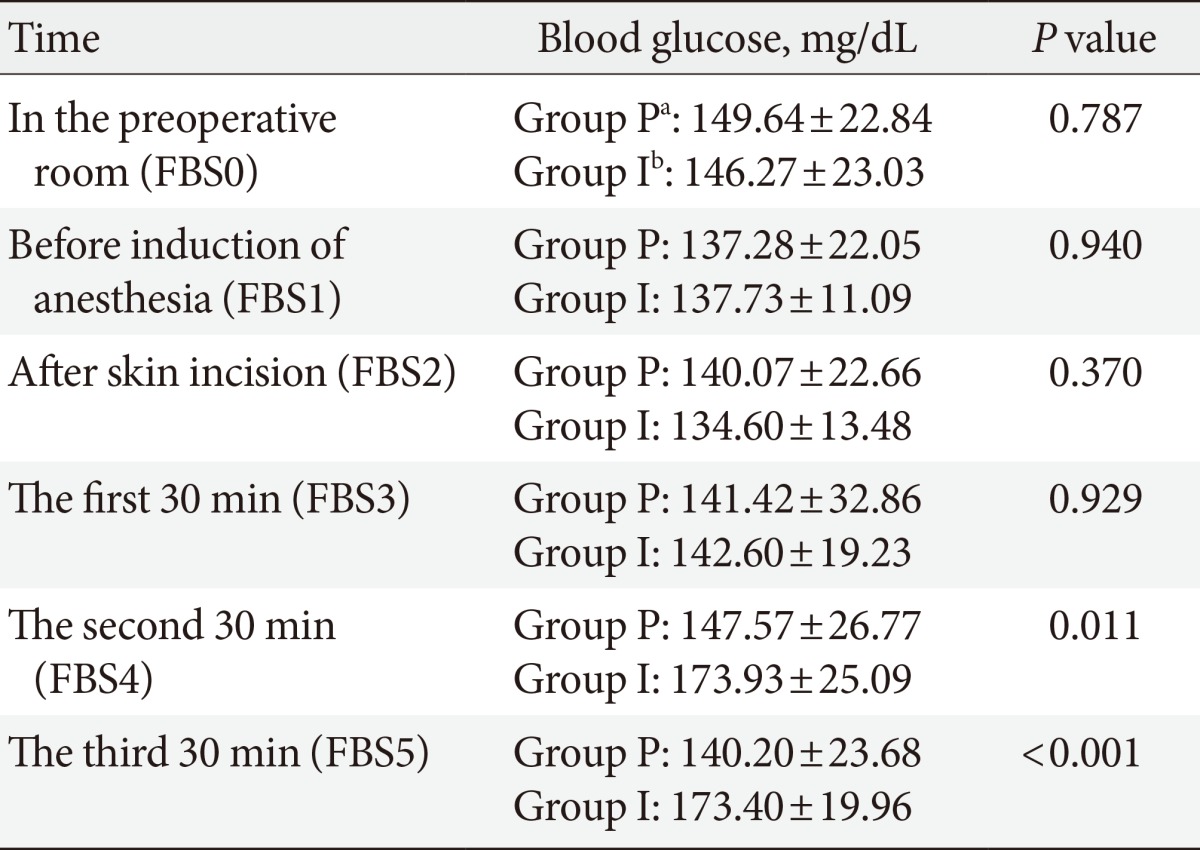
Table 2.
Mean of blood glucose in different times in two groups

Values are presented as mean±standard deviation.
FBS, fasting blood sugar.
aGroup P: propofol, bGroup I: isoflurane
Mean of blood glucose in different times in two groups

Values are presented as mean±standard deviation.
FBS, fasting blood sugar.
aGroup P: propofol, bGroup I: isoflurane