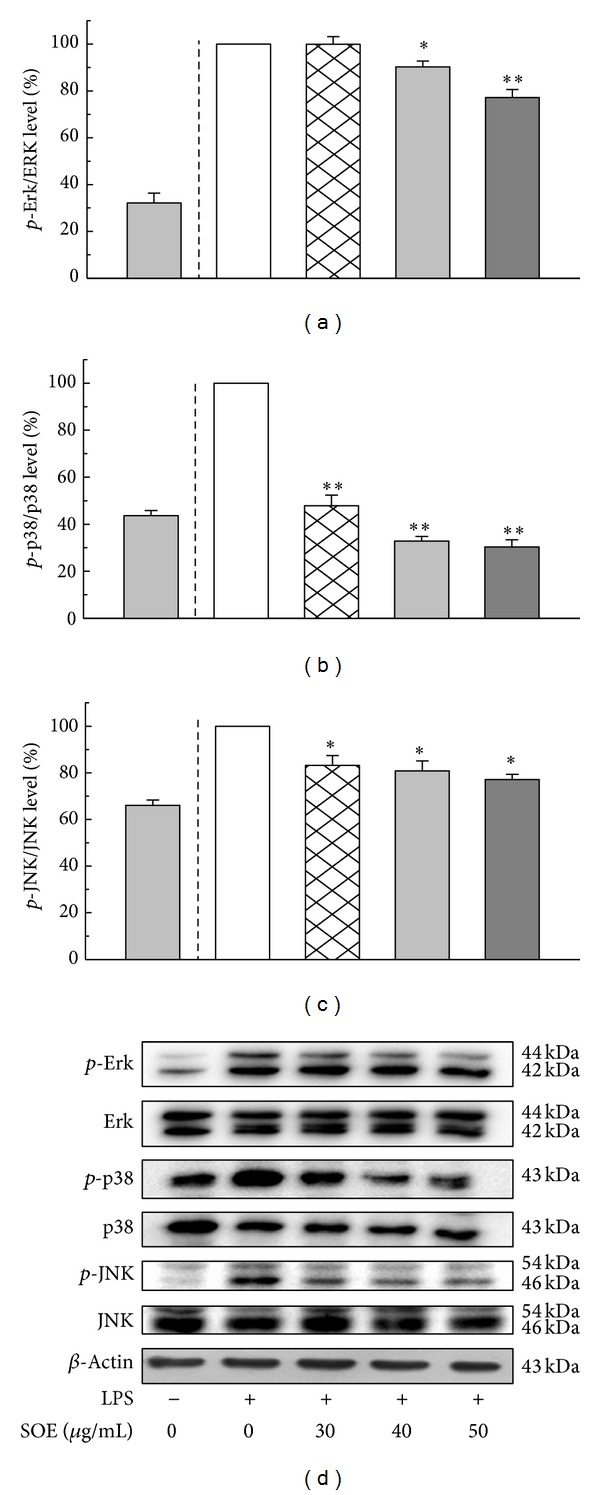
Figure 4.

Effects of SOE on the expression of p-Erk, p-p38, and p-JNK in LPS-stimulated RAW264.7 cells. Cells were pretreated with the indicated doses of SOE for 1 h and then stimulated with 1 μg/mL LPS for 1 h. Bar values are means ± SD of three independent experiments. The electrophoresis experiment was repeated three times, and one representative result is shown here. A significant difference from the control (LPS alone) was indicated as *P < 0.05 or **P < 0.01 by Student's t-test.
