
Figure 4.
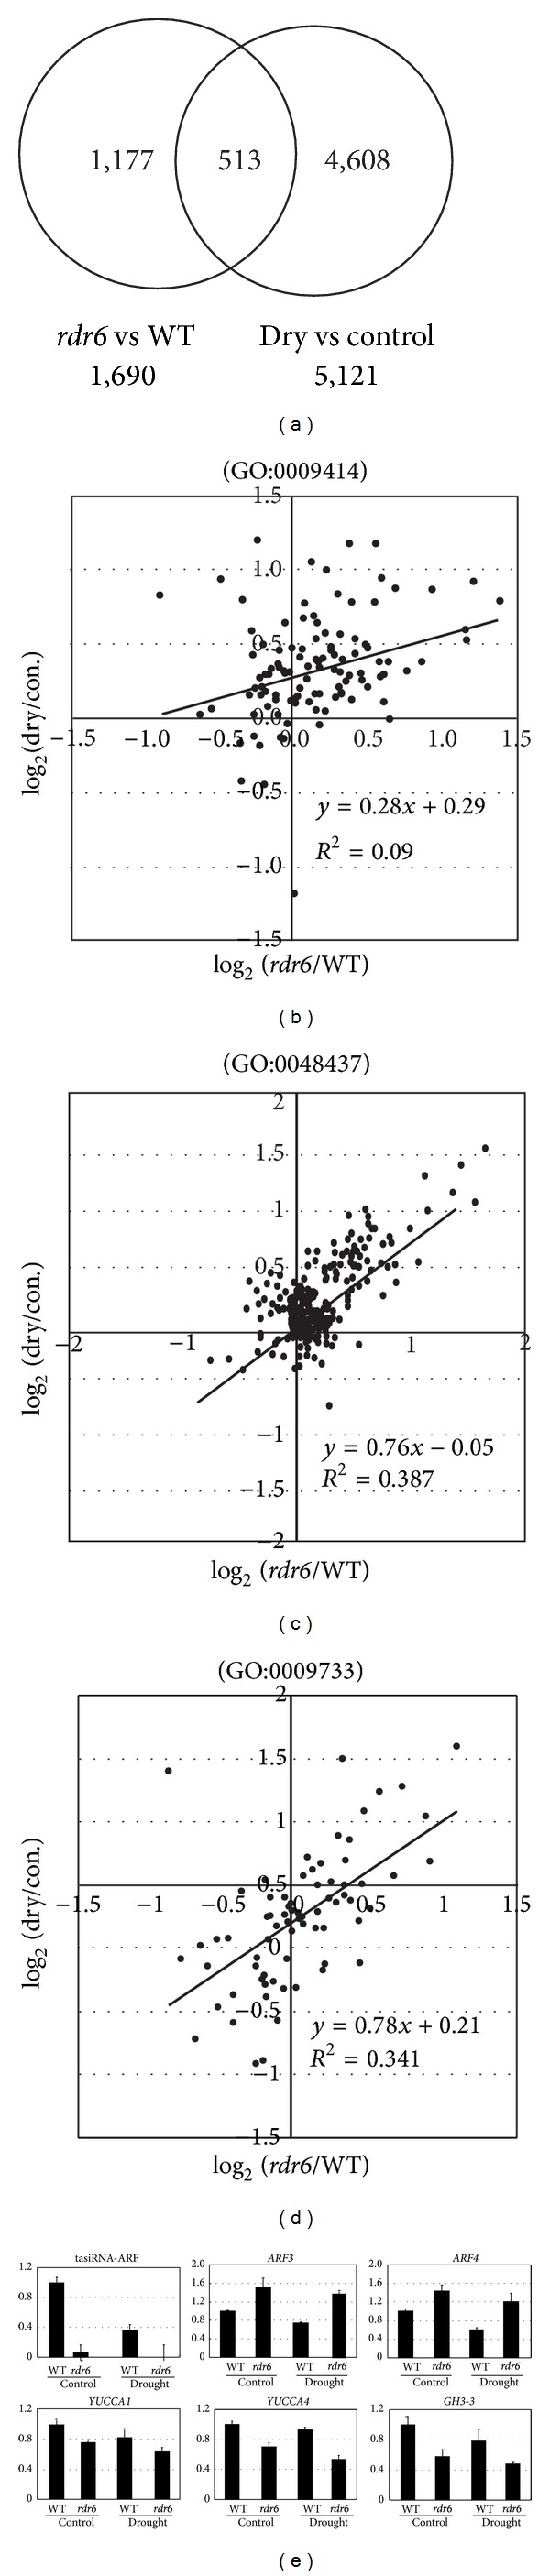
Microarray analysis of flower buds in plants under drought stress. (a) Venn diagram of differentially expressed genes in RDR6 plants compared to wild-type plants and drought stress-responsive genes. Statistically significant differentially expressed genes were identified based on the following criteria: FDR of 2-way ANOVA (rdr6 versus WT or drought-stressed versus nonstressed) < 0.075. ((b)–(d)) Scatter plot analysis of genes from different categories of GO terms. Horizontal axis represents log2 ratio of (rdr6 non-stressed + rdr6 drought)/(WT nonstressed + WT drought). Vertical axis represents log2 ratio of (WT drought+ rdr6 drought)/(WT nonstressed + rdr6 non-stressed). (b) Scatter plot analysis of water deprivation response-related genes. (c) Scatter plot analysis of floral organ development-related genes. (d) Scatter plot analysis of auxin response-related genes. (e) RT-qPCR expression profiles of tasiRNA-ARF, ARF3, ARF4, GH3-3, YUCCA1, and YUCCA4 in flower buds of rdr6 mutant and wild-type plants subjected to drought stress or nonstressed control.