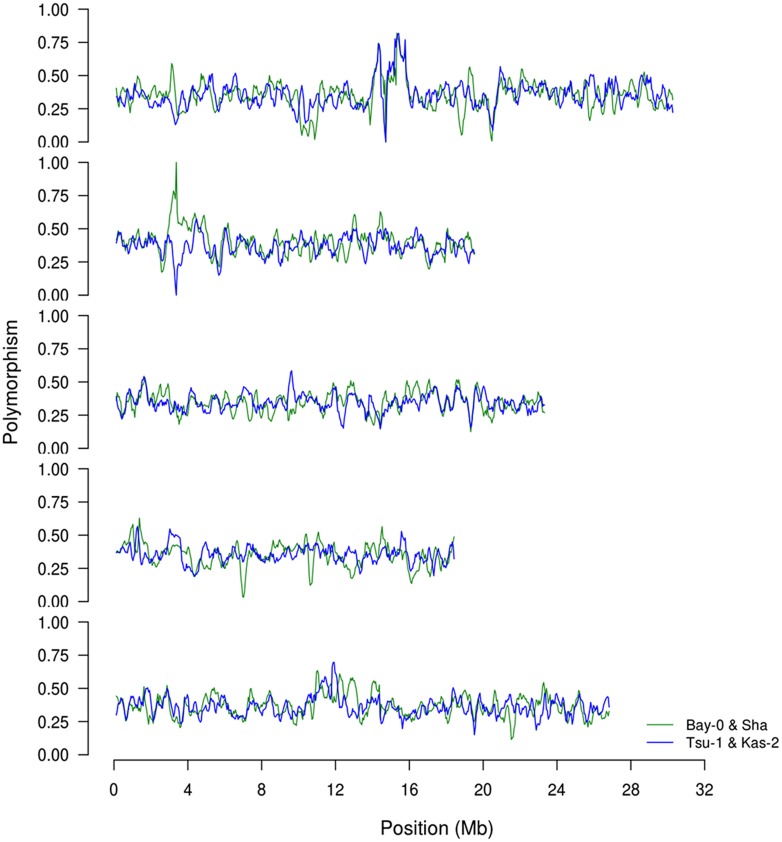
FIGURE 1.
Comparison of SNP distributions in the recombinant inbred line (RIL) populations. We obtained previously published single nucleotide polymorphism calls between the four genotypes, Bay, Sha, Kas, and Tsu. Using this data, we estimated the distribution of SNPs on chromosomes 1–5 (top to bottom) based on a sliding window of 250 Kb along the chromosome. The frequency is shown as the fraction of polymorphisms per 100 bp between the two parents for BayxSha (green) and KasxTsu (blue) RIL populations.

