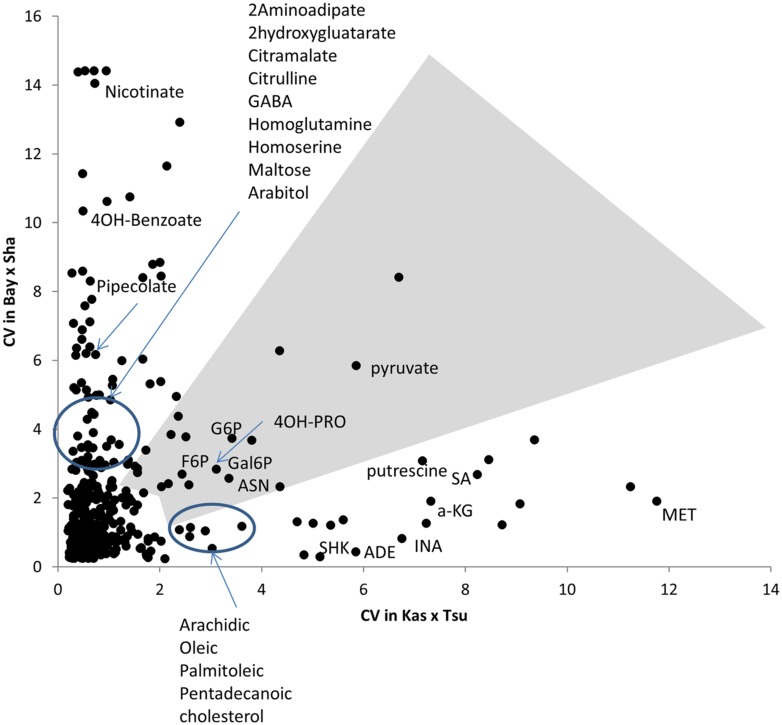
FIGURE 4.
Different modules of metabolic variation in different populations. Comparison of metabolite CV across all the RILs in the Bay × Sha and Kas × Tsu populations for 258 metabolites where CV could be estimated in both populations and that showed significant heritability’s in both populations. The gray polygon shows metabolites with elevated phenotypic variation in both populations. Below the polygon are metabolites with high variation only in Kas × Tsu while to the left are metabolites that show elevated variation in only Bay × Sha. Known metabolites are labeled while unknown metabolites are unlabeled. Elevated variance is defined as being in the top 10th percentile of metabolites within a population.

