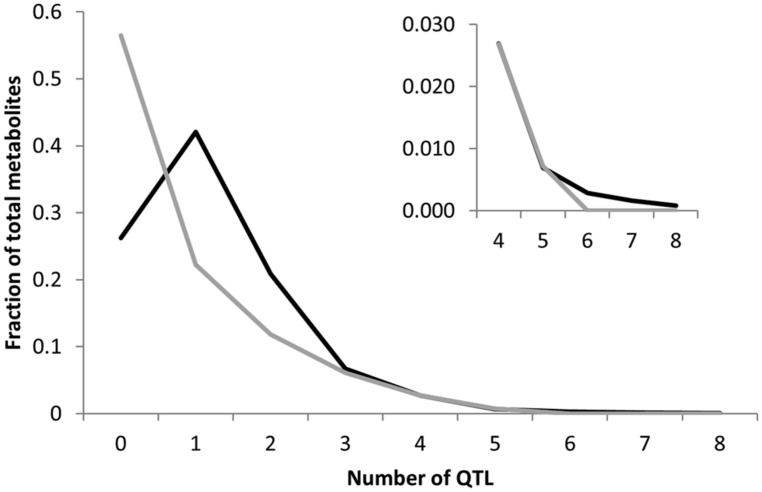
FIGURE 5.
Comparison of QTL detection across populations. Shown is the frequency of metabolites that detected a given number of nuclear genome Quantitative trait loci (QTLs) in the Bay × Sha RIL population (gray) and the Kas × Tsu RIL population. Inset shows a magnification of the X axis in the four to eight QTL region.

