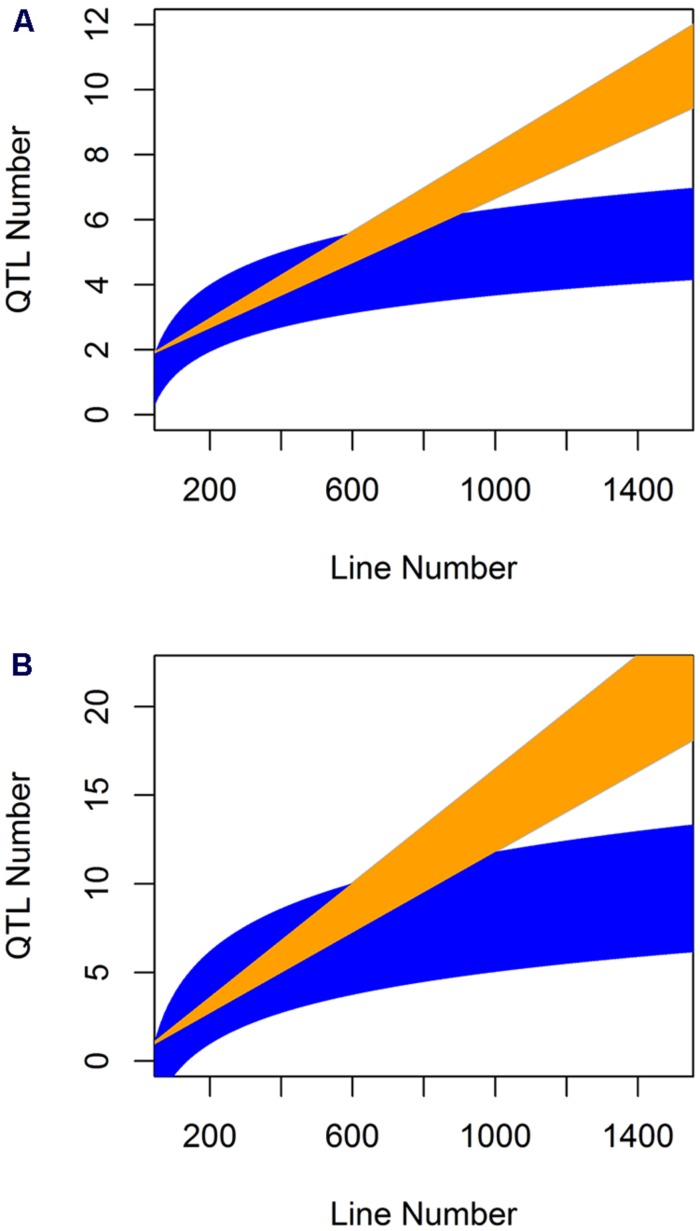
FIGURE 7.
Comparative prediction of QTL detection across population size. The slope and 95% confidence interval in the slope for both the linear and log-linear regression of QTL number by line number was obtained for the aliphatic (A) and indolic (B) glucosinolates across five populations where they were measured with the same experimental design and technical protocol. These estimated slopes were then use to plot the predicted QTL number detected per populations of a given line under the linear and log-linear predictions. Yellow shows the linear prediction and blue the log-linear prediction.

