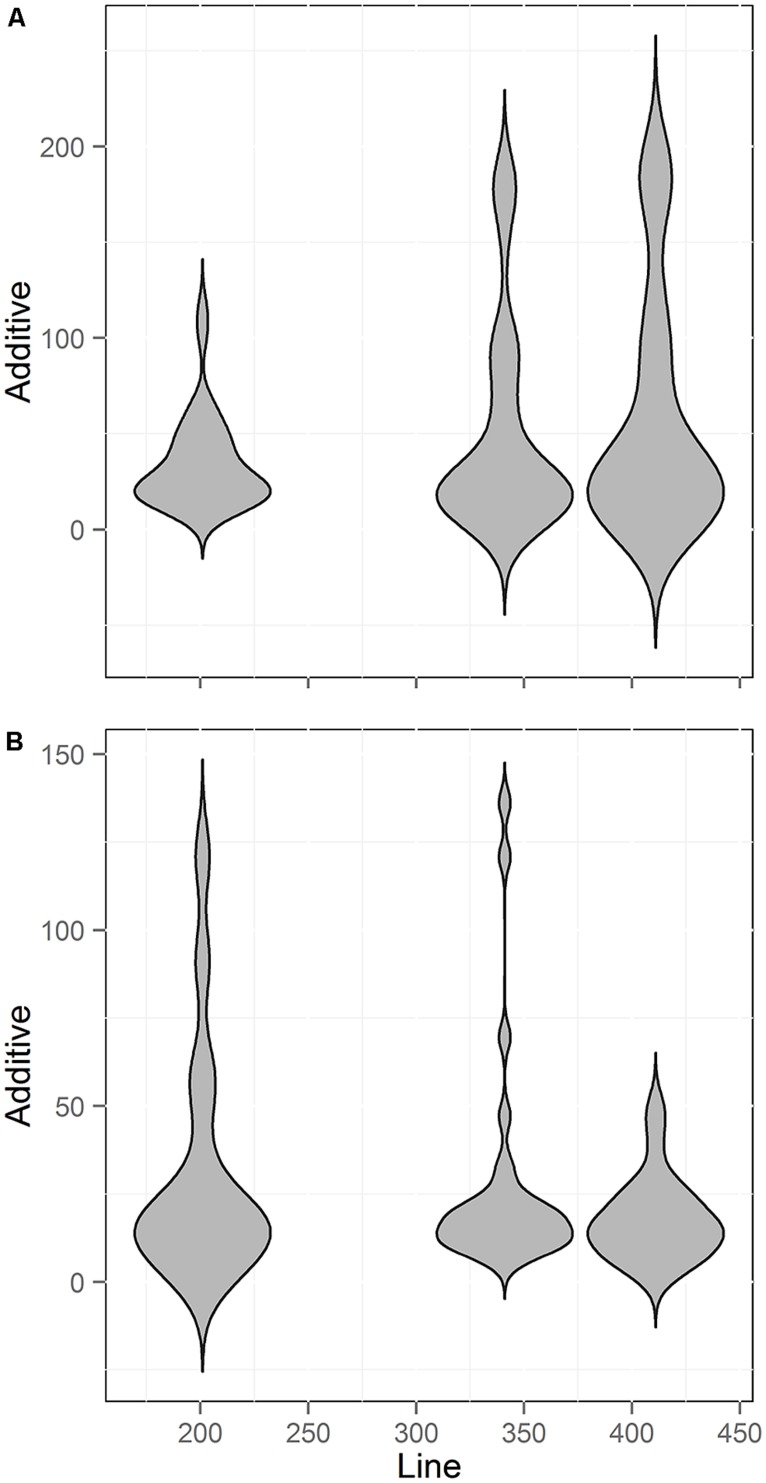
FIGURE 8.
Comparison of QTL Effect sizes by population size. Shown is the number of QTL identified across three different RIL populations of Arabidopsis with different line numbers. Two smaller populations could not be included because estimates of additive effects were not published. (A) Aliphatic glucosinolate traits (B) Indolic glucosinolate traits.

