
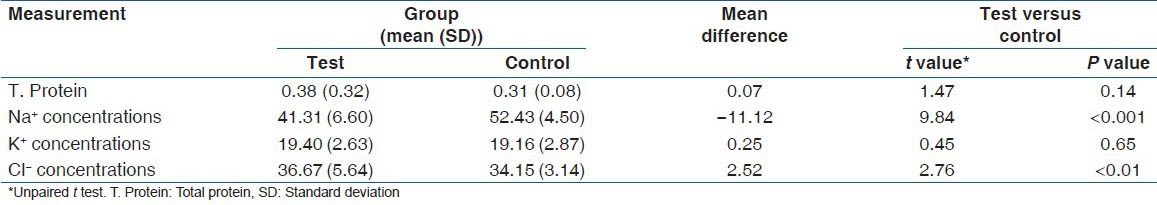
Table 4.
Comparison of T. Protein, Na+, K+ and Cl- concentrations between test and control groups
Official websites use .gov
A
.gov website belongs to an official
government organization in the United States.
Secure .gov websites use HTTPS
A lock (
) or https:// means you've safely
connected to the .gov website. Share sensitive
information only on official, secure websites.
Comparison of T. Protein, Na+, K+ and Cl- concentrations between test and control groups