. 2014 Jul-Aug;4(4):634–637. doi: 10.4103/2141-9248.139355
Copyright: © Annals of Medical and Health Sciences Research
This is an open-access article distributed under the terms of the Creative Commons Attribution-Noncommercial-Share Alike 3.0 Unported, which permits unrestricted use, distribution, and reproduction in any medium, provided the original work is properly cited.
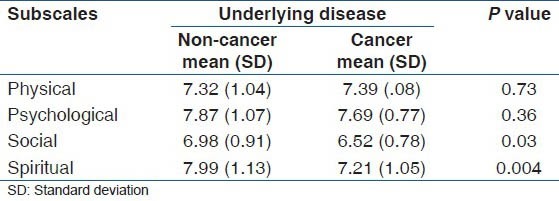
Table 4.
Comparison group analysis based on underlying disease

