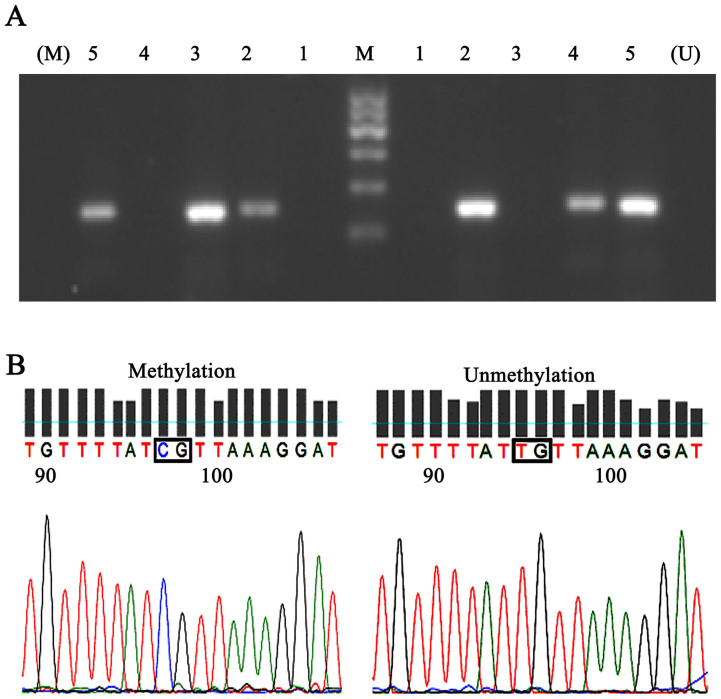
Figure 1. Representative data of the PCR products and the sequencing of IFN-γ gene.
(A) The MSP results of the IFN-γ gene. Shown are representative bands. U shows PCR products when amplified by unmethylated primers and M shows PCR products when amplified by methylated primers. Lane 1 shows a negative control. Lane 2 and 5 shows samples with partial methylation. Lane 3 shows samples with total methylation. Lane 4 shows an unmethylated sample. (B) Sequencing of the IFN-γ gene with representative data of CpG with Unmethylation and Methylation.

