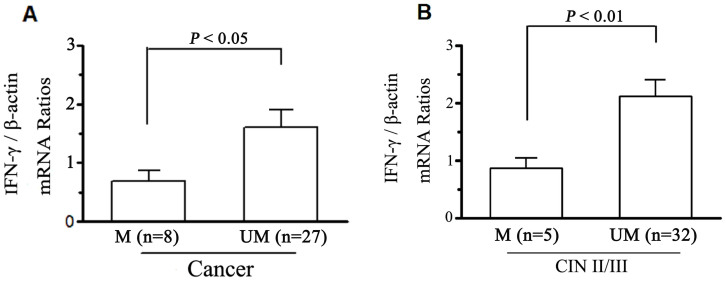
Figure 2. CpG methylation and mRNA expression of the IFN-γ gene in cervical tissues.
IFN-γ mRNA expression were detected using quantitative realtime RT-PCR. The quantified value was defined as the ratio of the IFN-γ PCR products compared with those of the β-actin. Columns represent mean value of IFN-γ mRNA levels of cervical cancer (A) and CIN II/III (B). M and UM represent methylation and unmethylation respectively.

