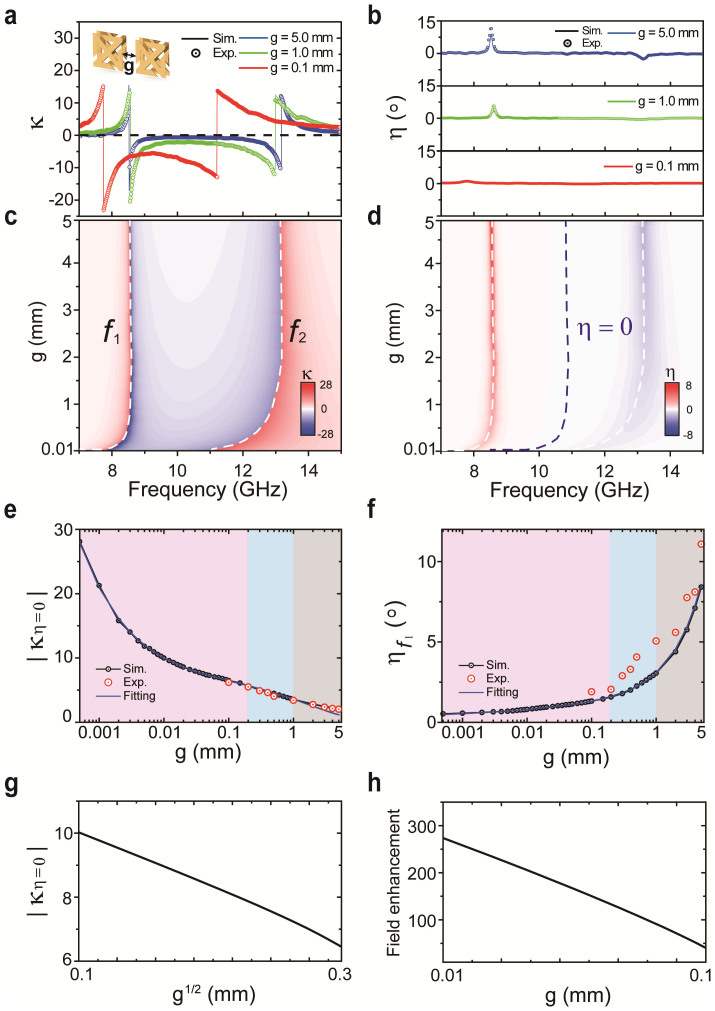
Figure 3. Effective parameters as a function of the gap width for the CDZM.
Comparisons are made between simulated (solid lines) and measured (circles) (a) chirality κ and (b) ellipticity η for different gap widths g. Simulated effective parameters (c) chirality κ and (d) ellipticity η are plotted with the gap width g ranging from 10 μm to 5 mm. The white dashed lines represent the frequencies f1 and f2, and the blue dashed line represents the region of pure optical activity, η = 0. (e) The chirality κ at the frequencies for which η = 0 and (f) the ellipticity η at the resonant frequency f1 as a function of the gap width g. The black circled line and the red scatters represent simulated and measured results, respectively. The theoretical fitting obtained from the coplanar strip capacitance formula is drawn as a blue line as a function of the gap width g. Three regimes of coupling (uncoupled: grey shaded; weak inter-molecular coupled: blue shaded; strong inter-molecular coupled: red shaded) regimes can be defined for the ranges of gap width. As the gap width decreases, κ increases significantly and η decreases. Comparison between the (g) chirality parameter |κη = 0| and (h) field enhancement factor with varying gap width g in the strong inter-molecular coupled regime.

