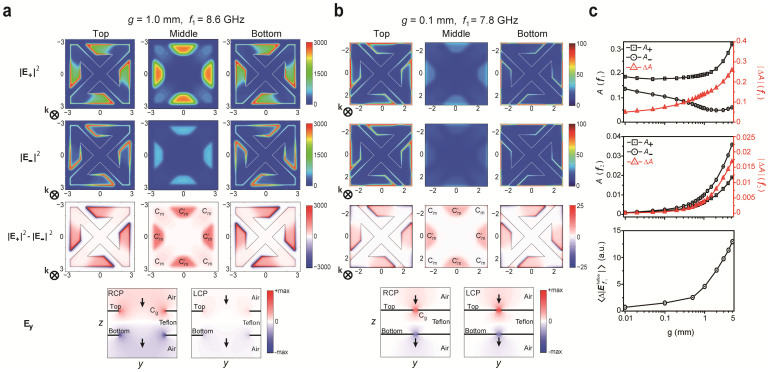
Figure 4. Gap dependence of the electric field distribution and absorption.
Electric field intensity distribution for RCP (|E+|2) and LCP (|E−|2), the difference of the electric field (|E+|2 − |E−|2) and horizontal electric field amplitude Ey for RCP and LCP in the CDZM with g equal to (a) 1.0 mm and (b) 0.1 mm at the resonance frequency f1. Electric fields are confined in the region denoted as Cm and  for g = 1.0 mm whereas the electric fields are more localized around the gap for g = 0.1 mm reducing the electric fields at Cm and
  significantly. As a result, the difference of the electric field (|E+|2 − |E−|2) for RCP and LCP waves reduces significantly. (c) Absorption A+ (A−) for RCP (LCP) and the absorption difference |ΔA| as a function of the gap width g at f1 (top) and at f2 (middle) and difference of the average field stored in the Teflon substrate for RCP and LCP as a function of g (bottom).

