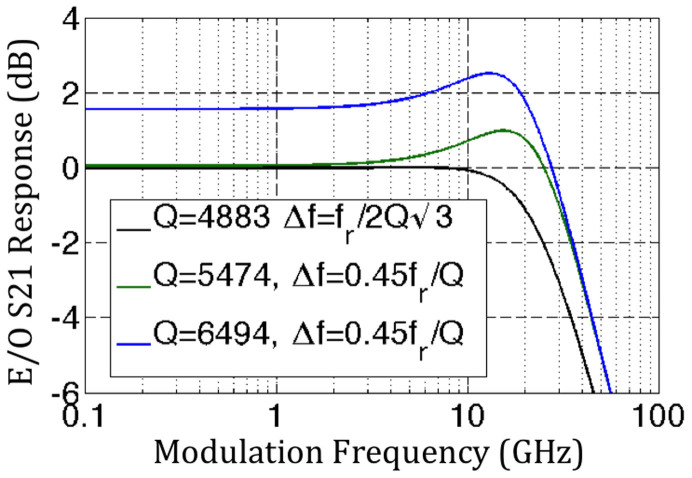
Figure 4. Comparison between calculated S-parameters for different Q-factors and laser detunings.
The black curve corresponds to the laser detuning expected to be the optimum based on a quasi-static analysis of the RRM, while the green and blue curves correspond to enhancement of either the bandwidth (green curve) or the modulation efficiency (blue curve) reoptimized taking peaking into account. All curves are normalized relative to the DC modulation efficiency of the black curve. Assumed Q-factors and laser detunings are indicated in the legend.

