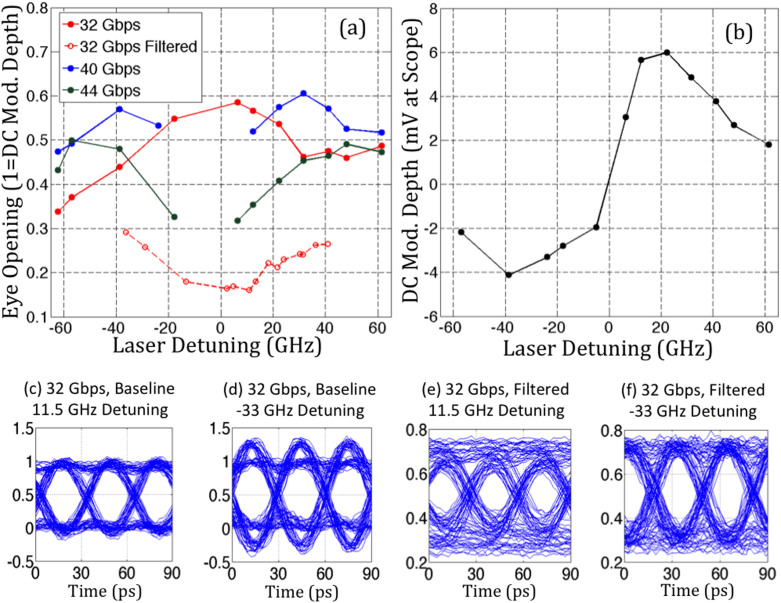
Figure 5. Recorded RRM eye diagrams evidencing peaking enhancement.
(a) Eye openings for different laser detunings at 32, 40 and 44 Gbps. At 32 Gbps, a second dataset was taken with additional penalization of the link (“filtered link”) introduced by a long, low grade SMA cable (−8 dB attenuation at 16 GHz modulation frequency). Eye openings are normalized to unit DC modulation efficiency. (b) summarizes the recorded DC modulation efficiency at different laser detunings. (c–f) show examples of individual eye diagrams in a penalized and non-penalized 32 Gbps link at low laser detuning (and thus small peaking) and moderate laser detuning (and high peaking). Here too, signal levels are normalized to unit DC modulation efficiency. Eye diagrams were recorded with PRBS 7 signals and 2 Vpp. Maximum signal levels in (e–f) are below one since the longest strings of consecutive zeros and ones were too short to fully reach stabilized DC levels. Eye diagrams are pattern lock averaged with a trigger generated every time the PRBS sequence is restarted, correctly representing ISI but averaging out receiver noise extrinsic to the RRM.

