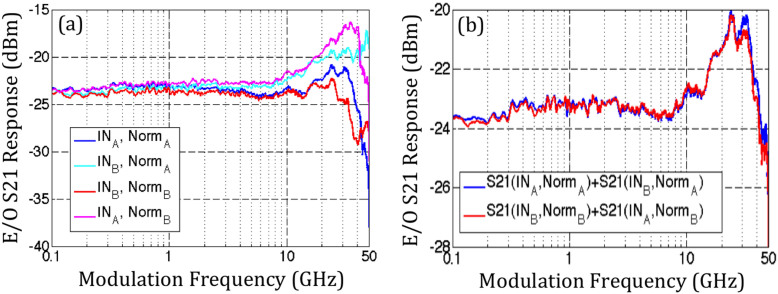
Figure 8. Example of datasets taken with different test setup configurations and resulting de-embedded S-parameter.
(a) shows the four measurement configurations, with electrical signals injected either through pad frame A or B (INA and INB) and S21 curves normalized relative to the signal levels at either pad frame (NormA and NormB). (b) shows the averaged S-parameters obtained with two different configurations, with excellent consistency obtained between the two datasets.

