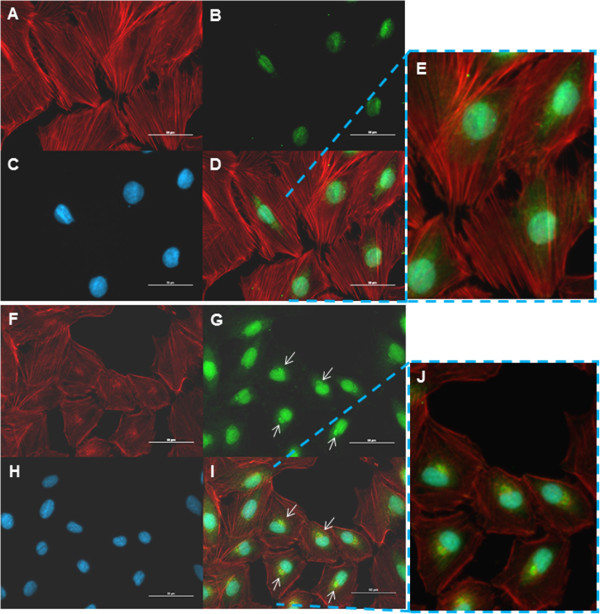
Figure 3.

p49-adenovirus treatment reduced actin contents, and altered actin fiber structure as well as cell morphology. A-E: H9C2 cells that were infected with GFP-control adenovirus. A. Actin fibers were well expressed and well organized in control adenovirus infected cells. B. The green fluorescence revealed the nuclei which were stained with p49 antibody and an Alexa Fluor 488 labelled secondary antibody. C. Nuclei were stained with DAPI. D. Overlap of the image A, B and C. E. Digitally enhanced image showing control virus infection did not change actin contents and structure in H9C2 cells. There is fainter, less intensive visualization of the GFP protein in the cytoplasm surrounding the nucleus (Figure 3B, D and E). F-J: H9C2 cells that were infected with p49-adenovirus. F. Actin fiber signal intensity was reduced and actin fibers were disorganized. G. The green fluorescence revealed both endogenous and adenovirus delivered exogenous p49 proteins that were stained with p49 antibody and an Alexa Fluor 488 labelled secondary antibody. The p49/STRAP proteins were mainly localized in the nuclei. Part of the p49 protein was asymmetrically distributed within the cells (arrows). H. Nuclei were stained with DAPI. I. Overlap of the images F, G and H. The arrows pointed to the yellow “dots”, which were a result of the merger of green and red fluorescence, which indicated that part of the p49 proteins (in green) were co-localized with actin fiber (in red) within the cells. J. Digitally enhanced image showing that p49-adenovirus treatment reduced actin contents, and altered actin fiber structure as well as cell morphology.
