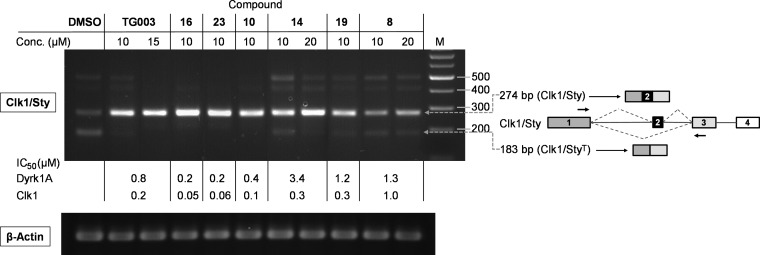
Figure 2.
Modulation of the Clk1/Sty splicing pattern by the Dyrk1A/Clk1 inhibitors in STO cells. The test compounds were added to the cell medium at the indicated concentrations for 4 h. DMSO was used as control (0.05%). Total RNA was purified, and the splicing pattern was analyzed by RT-PCR. The splicing variants and their expected PCR products using the primers indicated by arrows are depicted on the right. For comparison, IC50 values against the recombinant enzymes are also given; for a more detailed description, see Supporting Information, 1. Biology.

