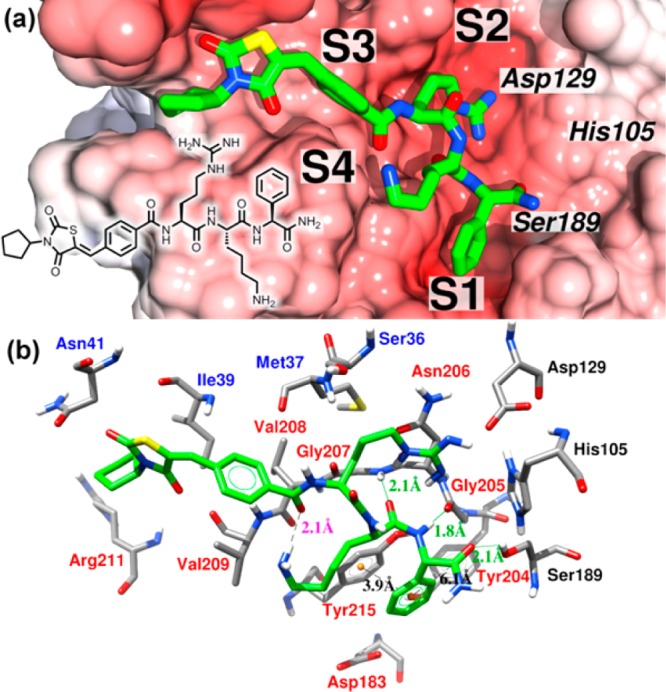
Figure 1.

Close-up view of the docked complex. The binding mode of the ligand 35 obtained using AD Vina is shown in green.34 (a) Electrostatic potential calculated using the program APBS with the linear Poisson–Boltzmann equation, contoured at ±11.0 kT/e and mapped on the solvent-accessible surface.35 Negatively charged surface areas are shown in red. The positions of the binding pockets S1, S2, S3, and S4 and the catalytic triad are indicated. The protein is presented in the serine protease standard orientation, i.e., looking into the active site cleft. (b) Detailed view of the main interactions presented in the proposed binding mode. Labels of the NS2B and NS3 residues are shown in blue and red, respectively, labels for the catalytic triad are black, distances of intermolecular hydrogen bonds are labeled in green, ligand intramolecular hydrogen bonds are in magenta, and the centroids of the aromatic rings, involved in π–π stacking interactions, are colored in orange with respective distances labeled in black. The graphic was generated using Chimera.36
