
Figure 9.
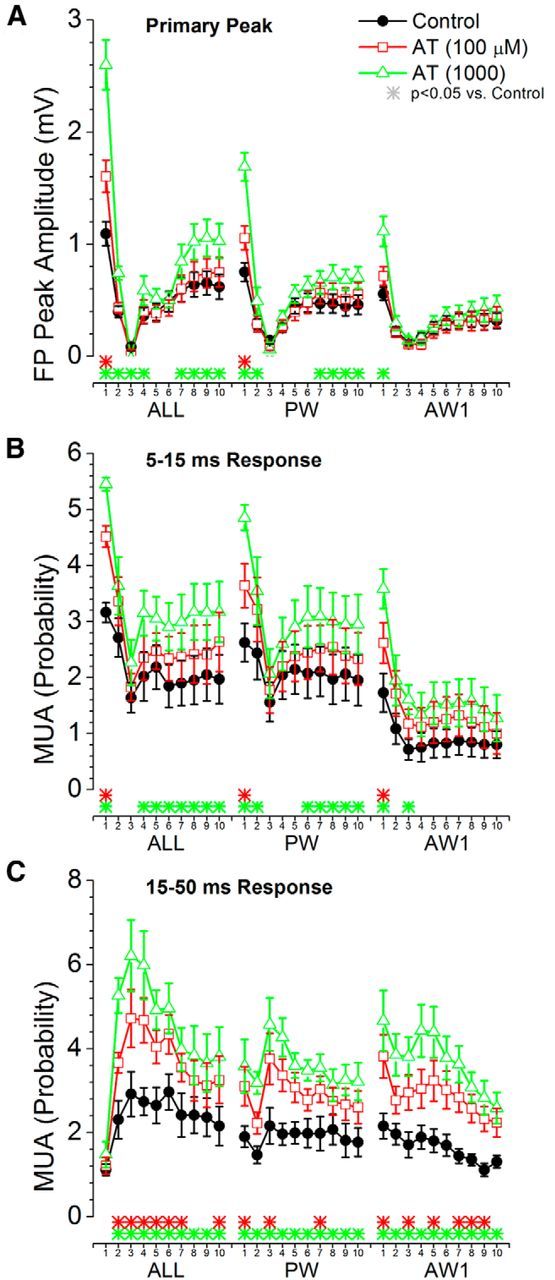
Population data measuring the effect of cortical deactivation produced by a muscarinic antagonist on barrel cortex responses evoked by high-frequency whisker deflections at 10 Hz. A, Primary negative peak amplitude of barrel cortex FP responses measured within a 5–30 ms window poststimulus during control and two doses of AT. The plot depicts the responses evoked by multiwhisker stimulation (6 whiskers simultaneously; ALL), the PW, and the strongest adjacent whisker (Aw1). The x-axis shows the responses evoked by each of the 10 stimuli in the 10 Hz train. The color-coded asterisks at the bottom mark significant differences between control and each drug dose for each of the stimuli in the train. B, Same as A, but MUA barrel cortex responses are measured during a short-latency (5–15 ms) window poststimulus. C, Same as A, but MUA barrel cortex responses are measured during a long-latency (16–50 ms) window poststimulus.