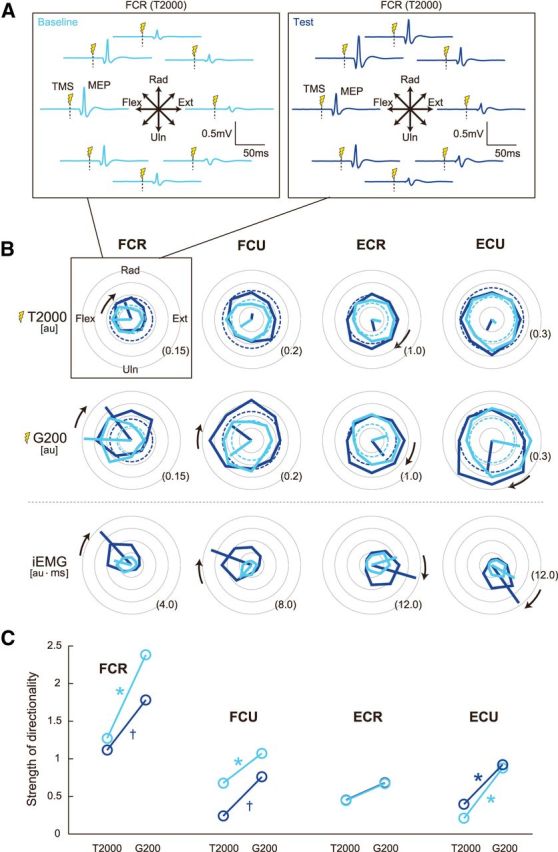
Figure 4.

Directional tuning of muscle activity and corticospinal excitability. A, MEP traces, evoked at T2000, obtained from the FCR muscle of a typical participant. Up–down and right–left plot corresponds to the radial–ulnar and extension–flexion movements, respectively. Cyan lines are baseline and blue lines are test. TMS was delivered at the vertical dotted lines. B, Tuning curves shown in polar coordinates. The MEP amplitude at T2000 and G200, and iEMG for the baseline (cyan) and test (blue) sessions. The broken circles displayed in the panels of MEP amplitudes indicate the MEP obtained at T0. The MEP at T0 was assumed to be independent of movement direction. The thick lines are PD vectors. CW black arrows indicate that the PDs were significantly rotated after adaptation (p's < 0.05). The values written at the outer circles indicate the value normalized by the level of the MVC. C, The magnitude of the PD vector of MEP at T2000 and G200 for each muscle is plotted to evaluate the strength of the directional modulation. The magnitude of PD vector is normalized by the MEP amplitude averaged across eight movement directions. *p < 0.05 and †p < 0.10 from T2000 to G200.
