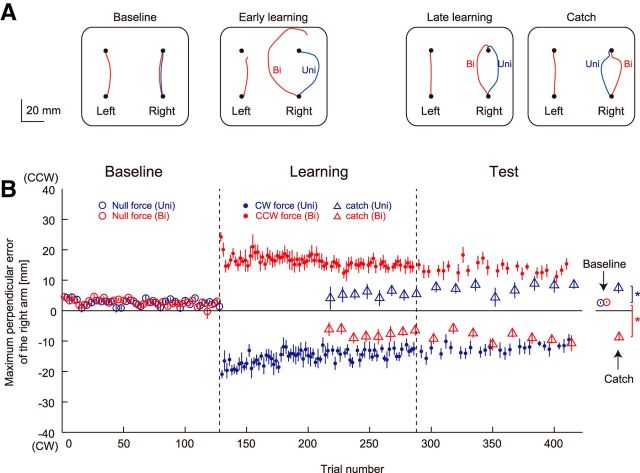
Figure 5.
Learning performance in Experiment 2. A, Movement trajectories of a participant during the baseline, early-learning (first 8 trials in the learning session), and late-learning (last 8 trials in the learning session) sessions, and during catch trials (no force field) in the test session. Unimanual and bimanual movements are represented by blue and red lines, respectively. B, Changes in the maximum lateral deviation of the right arm across participants during unimanual (blue) and bimanual movement (red). Open and filled circles represent the data for null-force and force-field trials, respectively. Triangles represent the aftereffect observed in the catch trials. A positive value indicates CCW direction. The values are presented as mean ± SEM. *p < 0.05.

