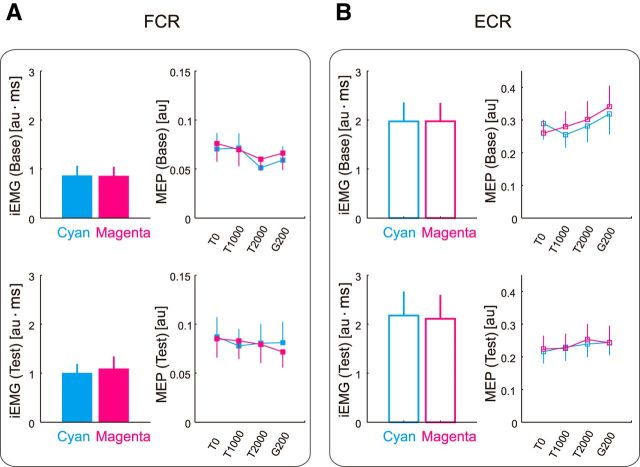
Figure 8.
Context-dependent changes in iEMG and MEP for the FCR and ECR in Experiment 3. A, B, iEMG and MEP at T0, T1000, T2000, and G200 for the FCR (A) and ECR (B). Cyan and magenta lines indicate that the data are for cyan and magenta target, respectively. The values are presented as mean ± SEM (the EMG data were normalized to the level of the MVC).

