
Figure 5.
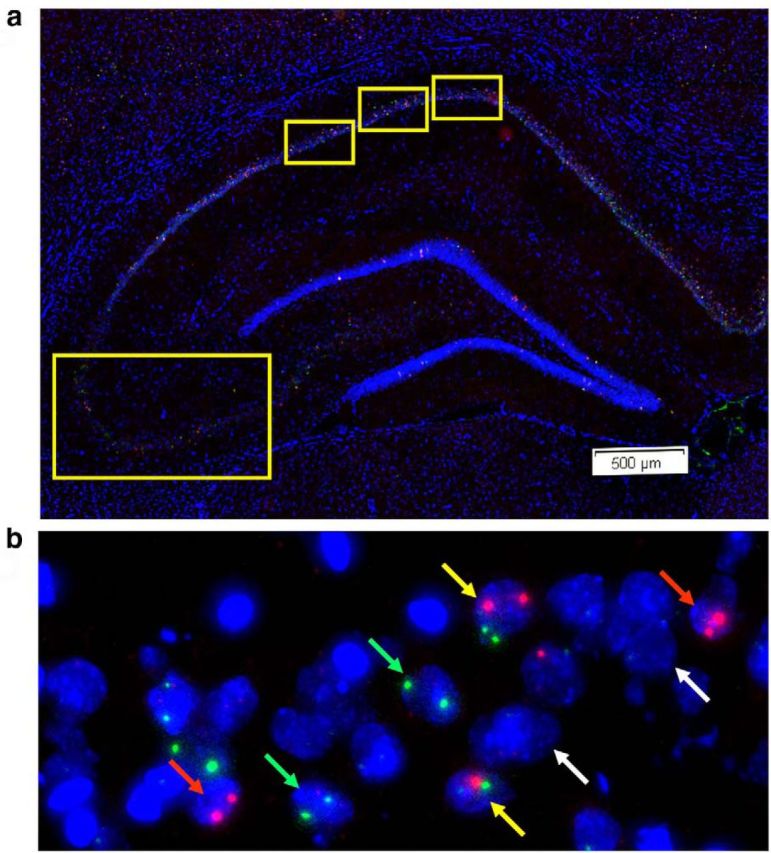
IEG expression in dorsal hippocampus. a, Low-magnification image of DAPI-stained dorsal hippocampus indicating the fields imaged for CA1 and CA3. The relative positions analyzed for CA1 (top) and CA3 (bottom, left) are indicated by yellow boxes. b, Representative 20× projection image of CA3 from an SAL-treated rat trained in context discrimination conditioning, showing Arc+ (red arrows), H1a+ (green arrows), Arc/H1a+ (yellow arrows), and negative (white arrows) neurons.