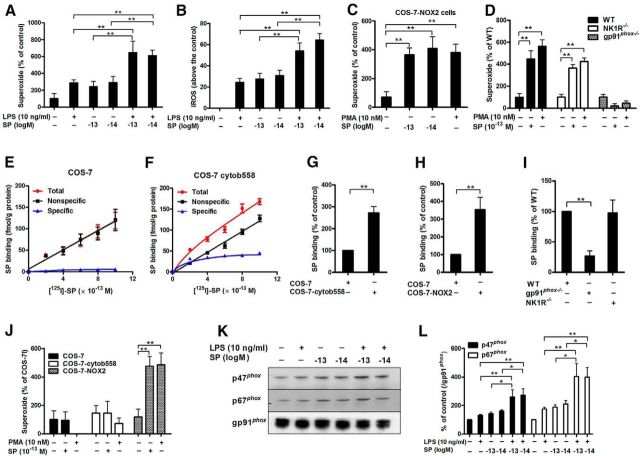
Figure 6.
Subpicomolar SP concentrations activate NOX2 through binding to the membrane subunit, gp91phox. A, Midbrain neuron-glia cultures were treated with subpicomolar concentrations of SP with or without LPS. Superoxide and (B) iROS production was measured (n = 5–7). C, SP-elicited superoxide production was determined in COS-7-NOX2 cells (COS-7 cells were transfected with gp91phox, p22phox, and cytosolic subunits of NOX2) and (D) neuron-glia cultures prepared from WT (C57BL/6J), NK1R−/−, and gp91phox−/− mice (n = 6 or 7). PMA was used as a positive control. E, [125I]-SP binding was performed in membranes of COS-7 and (F) COS-cytochrome b558 (transfected with membrane bound subunits, gp91phox and p22phox) cells. The total binding was measured by the inclusion of [125I]-labeled SP at concentrations ranging from 2 to 10 × 10−13 m, whereas nonspecific binding was determined in the presence of an additional 0.1 μm SP. Specific binding was calculated by the difference between total binding and nonspecific binding (n = 3). G, H, The binding capacity of subpicomolar levels of SP with gp91phox was determined by using [125I]-SP in membranes or whole cell of different transfected COS-7 cells (COS-7: transfected with empty vector; COS-7-cytochrome b558: transfected with gp91phox and p22phox; COS-7-NOX2: transfected with both membrane and cytosolic subunits) and (I) macrophages derived from wild-type, gp91phox−/−and NK1R−/− mice (n = 4–7). Specific binding was calculated and expressed as a percentage of WT or empty vector-transfected COS-7 cells. J, SP-induced superoxide was measured in COS-7, COS-7-cytochrome b558, and COS-7-NOX2 cells (n = 3–5). K, The membrane translocation of cytosolic subunits p47phox and p67phox induced by SP and/or LPS was measured using Western blot, and (L) the density of the blot was quantified (n = 5 or 6). Gp91phox, an abundant membrane protein, was used as an internal control. Our previous reports indicated that gp91phox could serve as a reliable internal membrane control (Hu et al., 2008; Qian et al., 2008; Gao et al., 2011b). The results are expressed as the percentage of controls (mean ± SEM) and were analyzed using one or two-way ANOVA by Tukey's post hoc test. *p < 0.05. **p < 0.01.

