
Figure 3.
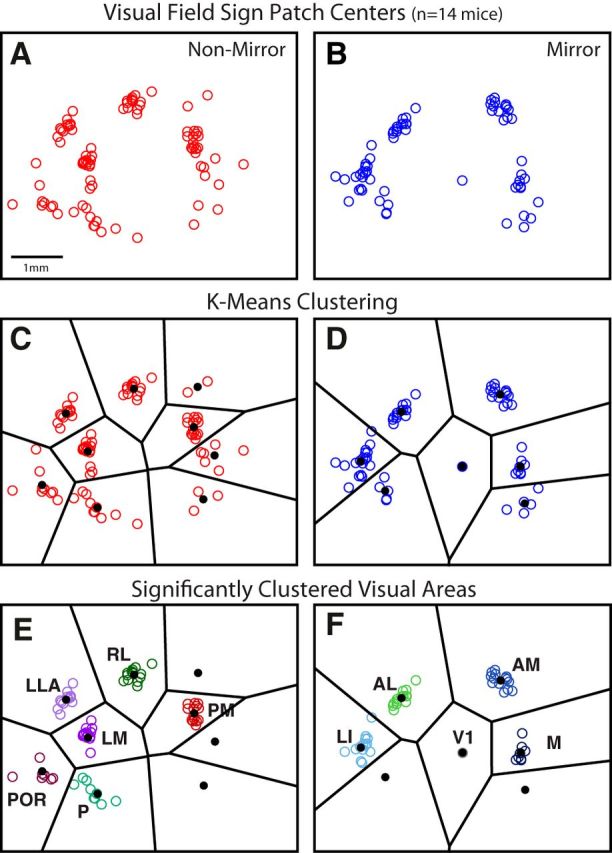
Classification of visual areas based on clustering of patch centers after alignment across animals. A, B, Scatter plot of mirror and nonmirror patch centers from each animal, after alignment of the maps across cases using the CoM of the largest patch (i.e., V1) and the direction of its horizontal gradient. Some patch centers fall into visible spatial clusters, whereas others appear more independent. C, D, Voronoi lines (black) illustrate boundaries between k-means clusters. Mean CoM of each cluster is shown as a black dot. E, F, Significant clusters remaining after shuffling analysis (see Materials and Methods). Patches from the more variable clusters were removed from further analysis. Also note that some significant clusters have fewer patches in E and F than in C and D. Patches in significant clusters were removed when there was a closer patch to the cluster's mean CoM, for the same animal. Remaining patch centers are considered reliably identified visual areas, found in a consistent spatial position across animals, labeled and color coded according to their grouping and anatomical position relative to V1. For the set of nonmirror image areas: LM, RL, PM, P, POR, and LLA. For the set of mirror image areas: V1, LI, AL, AM, and M. Tick marks represent 1 mm intervals in scale.