
Figure 7.
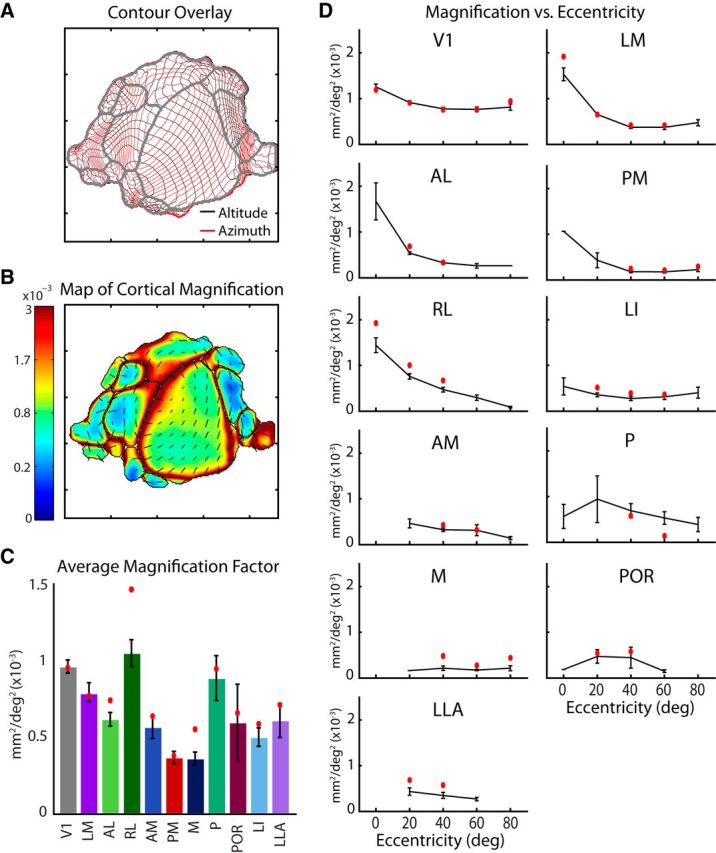
Differences in cortical magnification between areas and across visual eccentricity. A, Overlay of altitude and azimuth contours for the average map illustrating the relationships between vertical and horizontal gradients across cortical space. Contour lines are spaced at 5 degree intervals. B, Cortical magnification computed for each pixel of the average map (in mm2/deg2). An increase in magnification is observed at the lateral V1 border, at the intersection with LM and RL, corresponding to the center of visual space. A, B, Tick marks are 1 mm. C, Magnification averaged across all pixels for each area across cases, with the values for the average map in red. Although the majority of areas have lower magnification compared with V1, as would be expected from having smaller total cortical coverage, a few, notably RL, have similarly high magnification, perhaps associated with their incomplete coverage of visual space, or an emphasis on the nasal visual field. D, Relationship between magnification and visual eccentricity determined for each visual area across cases (black) and in the average map (red). A trend toward higher magnification at central representations is observed for several areas. However, others either lack coverage of the central visual field or show no trend.